Node Resource Monitoring Dashboard
Article Overview
Use this dashboard to analyze resources on a selected Search Anywhere Framework cluster node. It shows system CPU and memory usage, disk space, read and write metrics, open HTTP connections, file descriptors, and the state of selected thread pools.
The panels help identify periods in which metrics change and determine the next diagnostic step. This dashboard cannot identify the process that causes system load, the cause of increasing connections, or the specific operations that create a pool queue.
Dashboard Contents
Global and Local Filters
The dashboard provides the following controls:
Periodsets the time range for viewing dataNodeselects a cluster node for detailed analysisTime Intervalsets the resolution of time chartsThread Pooldetermines which thread groups appear on the corresponding chart
Color Indication
Color indication helps quickly identify when a metric approaches the warning or critical zone. Use it as a guide for an initial assessment, not as independent proof of a problem.
Color indication identifies the resource that requires further analysis, but does not determine the cause of a metric change. The investigation sequence is described in the corresponding sections below.
Dashboard Metrics
Top Indicators
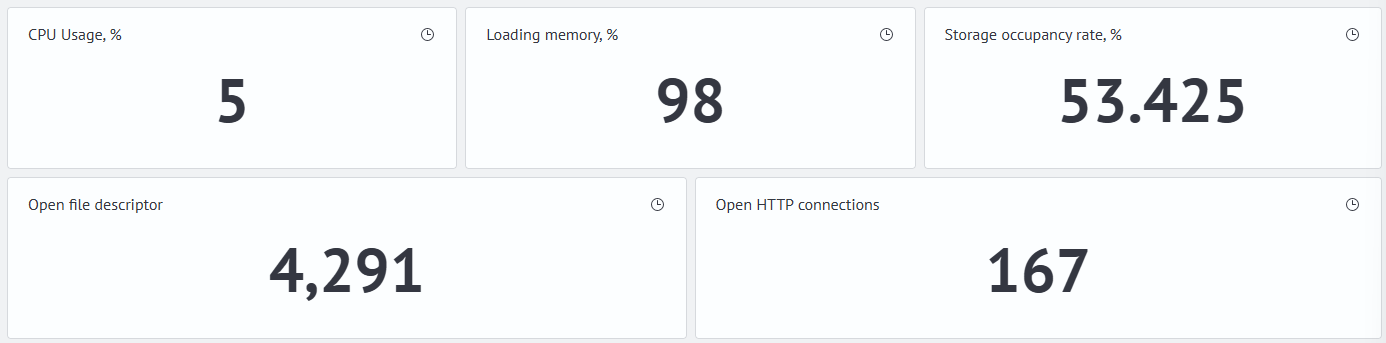
| Panel | Shows | When to Review |
|---|---|---|
CPU Usage, % | Overall CPU utilization on the selected node. | When searching for insufficient compute resources or long periods of high load. |
Memory Usage, % | Memory usage at the node level. | When memory consumption grows, JVM pauses occur, or memory shortage is suspected. |
Storage Utilization, % | Disk space utilization. | When data volume grows, write problems occur, merge operations run, or shards are restored. |
Open File Descriptors | The number of file descriptors opened by the process. | When errors occur while opening files or sockets, or the system limit may be reached. |
Open HTTP Connections | The number of open HTTP connections on the node. | When incoming traffic grows, load balancing is problematic, or many long-lived connections exist. |
System Load
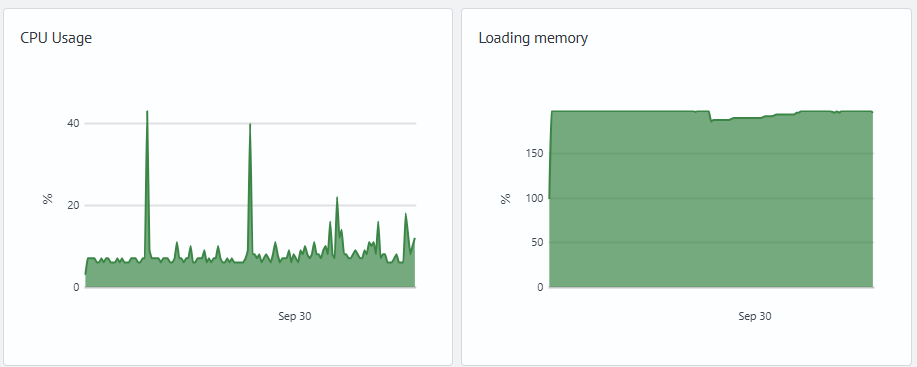
| Panel | Shows | When to Review |
|---|---|---|
CPU Usage | CPU utilization dynamics on the selected node. | When searching for long plateaus, sharp peaks, and correlations with search, indexing, or background operations. |
Memory Usage | Memory usage dynamics. | When memory grows, JVM pauses occur, GC is active, or a leak is suspected. |
Storage and Input/Output

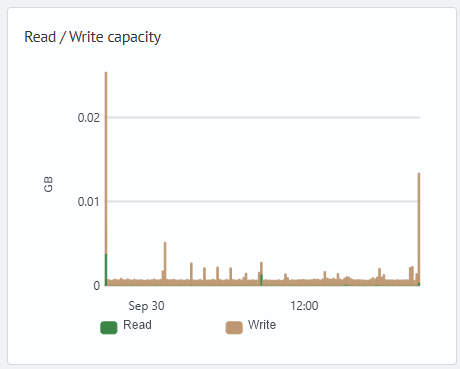
| Panel | Shows | When to Review |
|---|---|---|
Storage State | Used and available disk space. | When data volume grows, storage capacity may be insufficient, or restoration operations are running. |
Read/Write Volume | Disk read and write activity. | When assessing the effect of search, indexing, merge operations, and data restoration on disk. |
System Limits and HTTP Connections
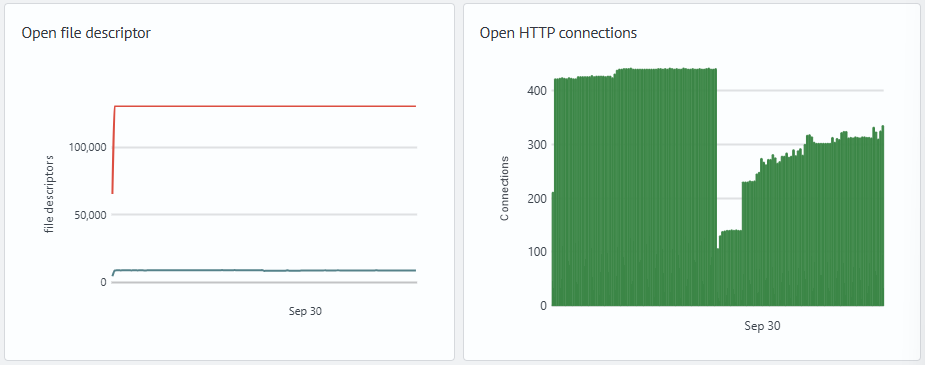
| Panel | Shows | When to Review |
|---|---|---|
Open File Descriptors | Open file descriptor dynamics and the remaining margin before the limit. | When descriptors grow consistently or errors occur while opening files and connections. |
Open HTTP Connections | Open HTTP connection dynamics on the node. | When incoming connections grow, load is imbalanced between nodes, or load balancing may be problematic. |
Thread Pools
| Panel | Shows | When to Review |
|---|---|---|
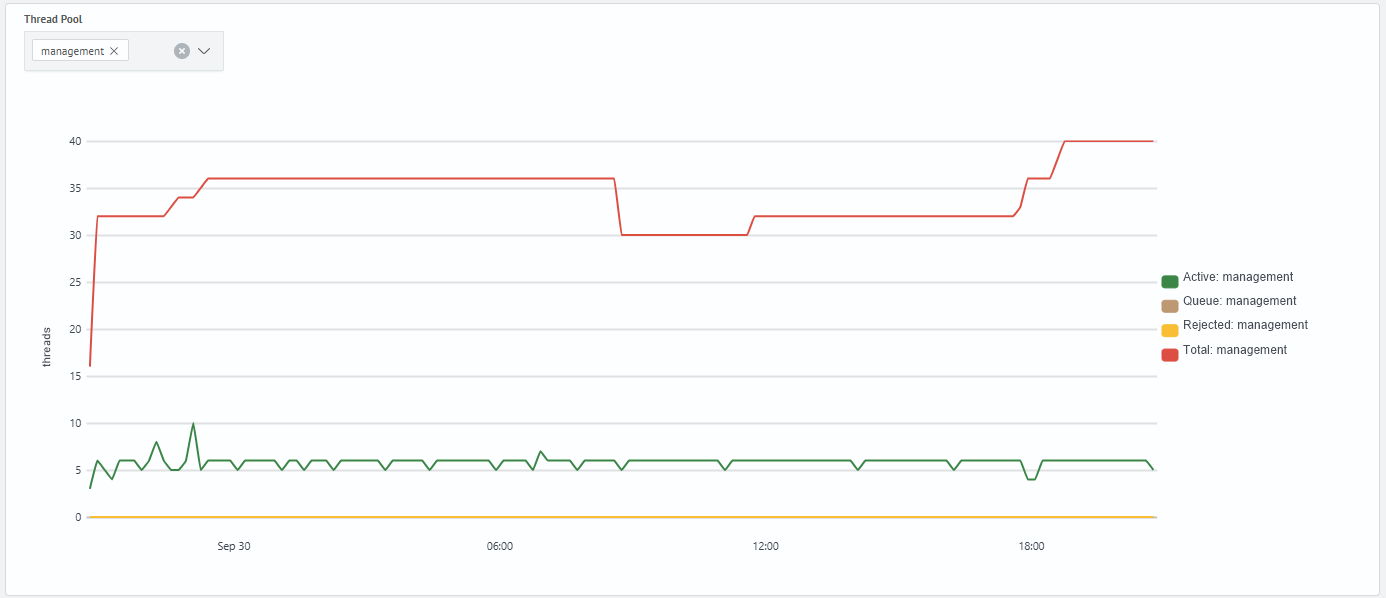
Active | The number of threads that execute tasks. | When checking whether the selected pool is busy. |
Queue | The number of tasks waiting to run. | When incoming load may exceed processing speed. |
Rejected | The number of rejected tasks. | When users receive errors or the pool does not accept new tasks. |
Total | The total number of threads in the pool. | For comparison with the active thread count. |
Problem Diagnosis Examples
Initial Node State Assessment
Use top indicators as the first step when assessing a selected node. They help quickly identify which resource requires detailed analysis in the charts below.
If CPU or memory is highlighted, review dynamics in the CPU and Memory Analysis section and correlate the period with search, indexing, and JVM activity. If disk is highlighted, proceed to the Disk and I/O Analysis section and assess the data growth rate. If file descriptors or HTTP connections grow, use the charts in the System Limits and HTTP Connections section and compare nodes with the same role.
CPU and Memory Analysis
Analyze system load by chart shape: short peaks, sustained growth without returning to normal values, stepwise growth, and a return to the usual level require different investigation.
The dashboard shows overall CPU utilization on a node, but does not attribute it to individual processes. If other services run on the server, this chart cannot attribute the load to Search Anywhere Framework.
If growth coincides with search operations, review the Query Performance Monitoring and Cluster Query Count by Type dashboards. If it coincides with writes, use Indexing Performance Monitoring. If memory grows, pauses appear, or node stability declines at the same time, review JVM Node Monitoring.
Disk and I/O Analysis
Analyze decreasing free space and increasing disk activity separately. If free space decreases consistently, review write volume and rate in Indexing Performance Monitoring.
If I/O grows, correlate the period with search load in Query Performance Monitoring and with indexing. When shards are restored or relocated, also review Cluster Health.
If the change coincides with data flow through Logstash, use Logstash Monitoring and Logstash Node JVM Monitoring.
System Limits and HTTP Connections
The file descriptor limit line corresponds to the limit configured in the operating system for the Search Anywhere Framework process. Before assessing the margin, compare it with the actual LimitNOFILE values in the systemd configuration or the nofile values in user limits. Recommended values and configuration steps are provided in Open File Descriptors.
Analyze HTTP connections not only by growth on a single node, but also by their distribution between nodes. Sustained growth can indicate increased client traffic or many long-lived connections.
Compare nodes with the same roles. The number of HTTP connections on nodes with the same role should be roughly comparable, and it should be significantly lower on SA Master than on SA Data Storage.
If the number of connections grows on all nodes with the same role, review changes in user load in Cluster Query Count by Type. If growth is observed on only one node, review the load balancer configuration: its backend node list, weights, and distribution algorithm. Also rule out direct client connections to that node.
Thread Pool Analysis
Analyze thread pools with the node role in mind. Comparing different roles can lead to incorrect conclusions: master and data nodes have different expected operating profiles and different relevant pools.
| Node Role | Pools |
|---|---|
| SA Master | management, generic, search, fetch_shard_started, fetch_shard_store |
| SA Data Storage | write, bulk, search, refresh, flush, generic, fetch_shard_started, fetch_shard_store, management, sme, job_scheduler |
Signs of pool overload:
Queuegrows: tasks wait for an available threadRejectedgrows: some tasks are rejectedActiveapproachesTotal: the pool operates near full utilization
If overload is visible on only one node, review shard placement and state in Cluster Health. For the search pool, correlate the period with Query Performance Monitoring; for write and bulk, use Indexing Performance Monitoring.
Typical Scenarios
Sustained Growth in Open HTTP Connections
This scenario occurs when the number of open HTTP connections grows consistently and does not return to its usual level. This pattern can be related to growing user traffic, many long-lived connections, or users being pinned to individual nodes.
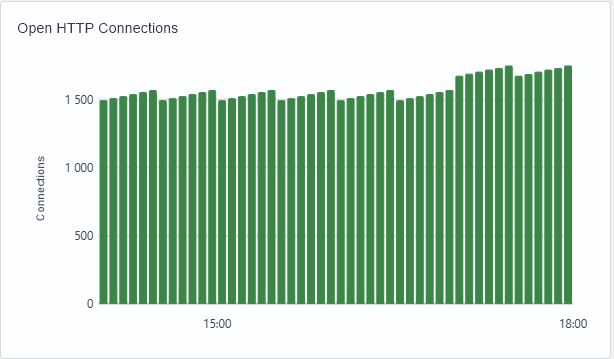
In the image, the number of open HTTP connections initially fluctuates around one level, then grows consistently and does not return to previous values until the end of the period. Compare the chart with nodes of the same role. If all nodes of the same type grow, review load changes in Cluster Query Count by Type. If one node stands out, review the load balancer configuration: backend node list, weights, distribution algorithm, and direct client connections to that node.
Approaching the Open File Descriptor Limit
This scenario occurs when the number of open file descriptors grows consistently and approaches the limit. In this state, the process may lack descriptors to open index files, logs, network sockets, and service files.

In the image, the number of open file descriptors grows from about 27,000 to 64,000 and approaches the limit line. The line represents the operating-system limit configured for the Search Anywhere Framework process, not an estimated value: compare it with LimitNOFILE or the nofile user limit. Recommended settings are provided in Open File Descriptors. As the margin decreases, check Search Anywhere Framework logs for Too many open files. The chart itself shows the risk of reaching the limit, but does not identify the cause of descriptor growth.
Sustained CPU Load
This scenario occurs when CPU utilization remains at one level for a long time and does not return to values usual for the node. Deviation can include values not only in the 80-100% range, but also around 50% if the node was previously stable at a lower load. The 80%, 90%, and 100% levels require special attention because the node has minimal remaining compute capacity.
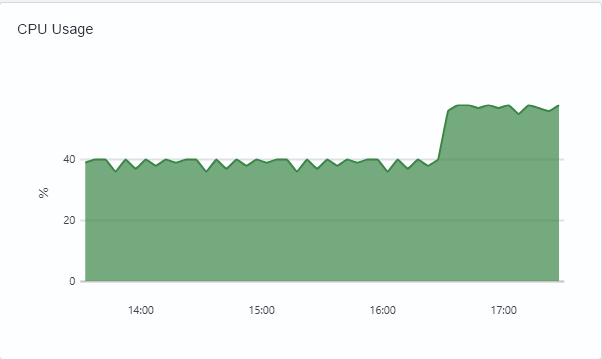
In the image, CPU utilization initially remains near 40%, then grows stepwise to about 55% and remains at that level until the end of the period.
This situation clearly indicates a Search Anywhere Framework problem only when Search Anywhere Framework is the only installed application and there are no other resource-intensive processes. If additional services run on the server, first check CPU consumption at the operating-system level and confirm that the Search Anywhere Framework process causes the load.
Growing Queue and Rejected Counter in a Thread Pool
This scenario occurs when one or more pools show a growing task queue, rejected tasks, or an active thread count that approaches the total number of threads in the pool.
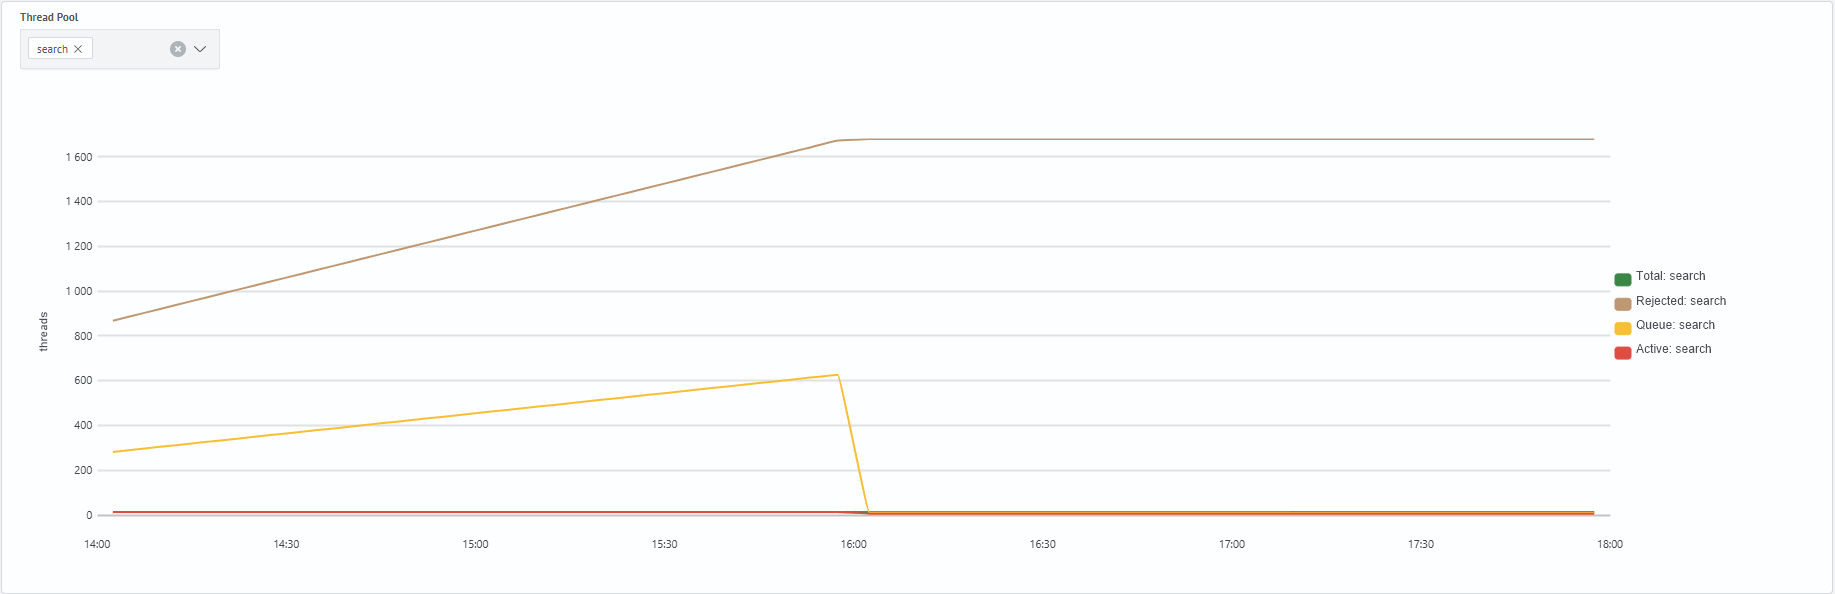
The image shows the selected search pool. The task queue grows, and the Rejected value increases with it. This means that some tasks were not accepted for processing.