Cluster Health Dashboard
Article Description
The dashboard is used to analyze the state of a Search Anywhere Framework cluster over a selected period. It shows the cluster status, changes in the number of nodes, shard status, node resource metrics, and related log messages.
The panels help identify changes in cluster state and determine the direction of further investigation.
Dashboard Composition
Global and Local Filters
The dashboard provides the following controls:
Periodsets the time range for viewing dataSeveritylimits the message log by severity levelSearch by messagehelps find records by message text
Color Indicators
Color indicators help quickly identify metrics that require investigation. Use them as a guide for an initial assessment, not as independent proof of a problem.
If a color zone indicates a possible resource shortage, check the metric trend and compare it with the cluster status, shard state, and log messages.
Dashboard Metrics
Top Status Indicators

| Panel | What it shows | When to check | Normal-operation indicators | When additional investigation is required |
|---|---|---|---|---|
Status | The overall state of shard allocation in the cluster. | At the beginning of troubleshooting, when data is unavailable, or when search and/or write errors occur. | The state matches the expected shard placement scheme. | Check a transition to yellow if it is not related to known maintenance or persists longer than expected. red requires identifying unassigned primary shards and assessing the availability of the affected data. |
Active Nodes | The number of nodes participating in cluster operation. | When a node loss, network problem, or service restart is suspected. | The number of nodes matches the approved architecture or a known maintenance period. | An unexpected decrease or frequent changes in the number of nodes should be compared with the cluster status and logs. |
Shard State and Distribution
| Panel | What it shows | When to check | Normal-operation indicators | When additional investigation is required |
|---|---|---|---|---|
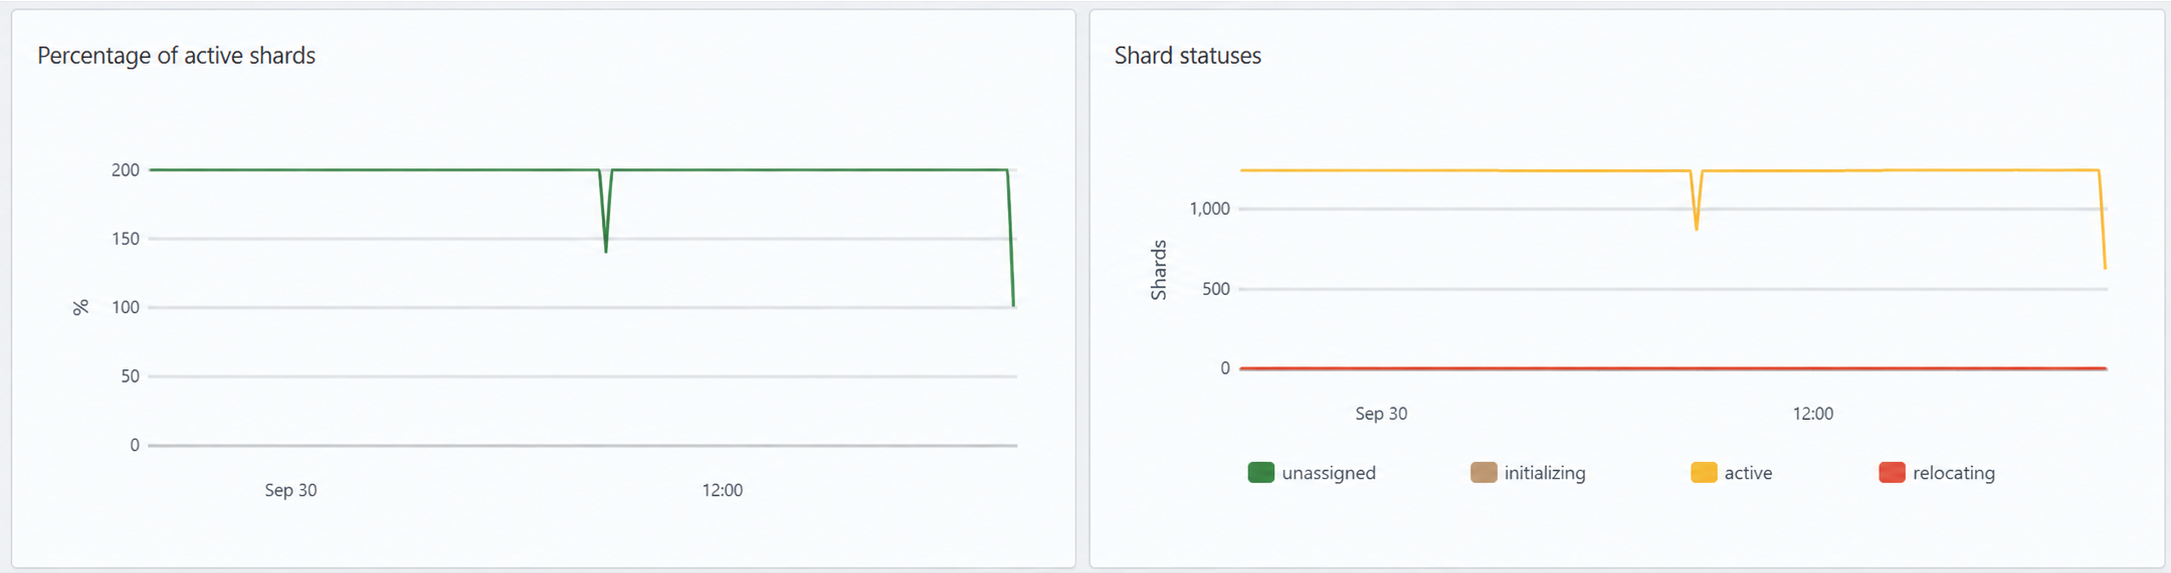
Active Shards Percentage | The proportion of shards available for search. | When the cluster status changes, after recovery from a failure, or when checking the completeness of shard allocation. | The metric returns to the expected level after shards are recovered or relocated. | Investigate a decrease if it persists, is accompanied by an increase in UNASSIGNED, or affects primary shards. The percentage alone does not show which data is affected. |
Shard Statuses | The distribution of shards by state: active, initializing, relocating, and unassigned. | When you need to determine whether recovery or relocation is in progress or whether there is a shard placement problem. | Initializing and relocating shards eventually become active; the number of unassigned shards does not increase. | Persistent INITIALIZING or RELOCATING states, as well as the appearance of UNASSIGNED, should be checked by replica type, allocation failure reason, and available resources. |
Node Summary Table

| Panel | What it shows | When to check | Normal-operation indicators | When additional investigation is required |
|---|---|---|---|---|
Node Summary Table | Node resource metrics: segments, CPU, memory, storage, HTTP connections, file descriptors, heap, and threads. | When you need to determine which node requires further investigation. | Resource metrics are comparable between nodes with the same role and remain within operational limits. | Investigate a node that stands out if the difference persists and coincides with a change in status, shard allocation, latency, or the number of errors. |
Log Panels
| Panel | What it shows | When to check |
|---|---|---|
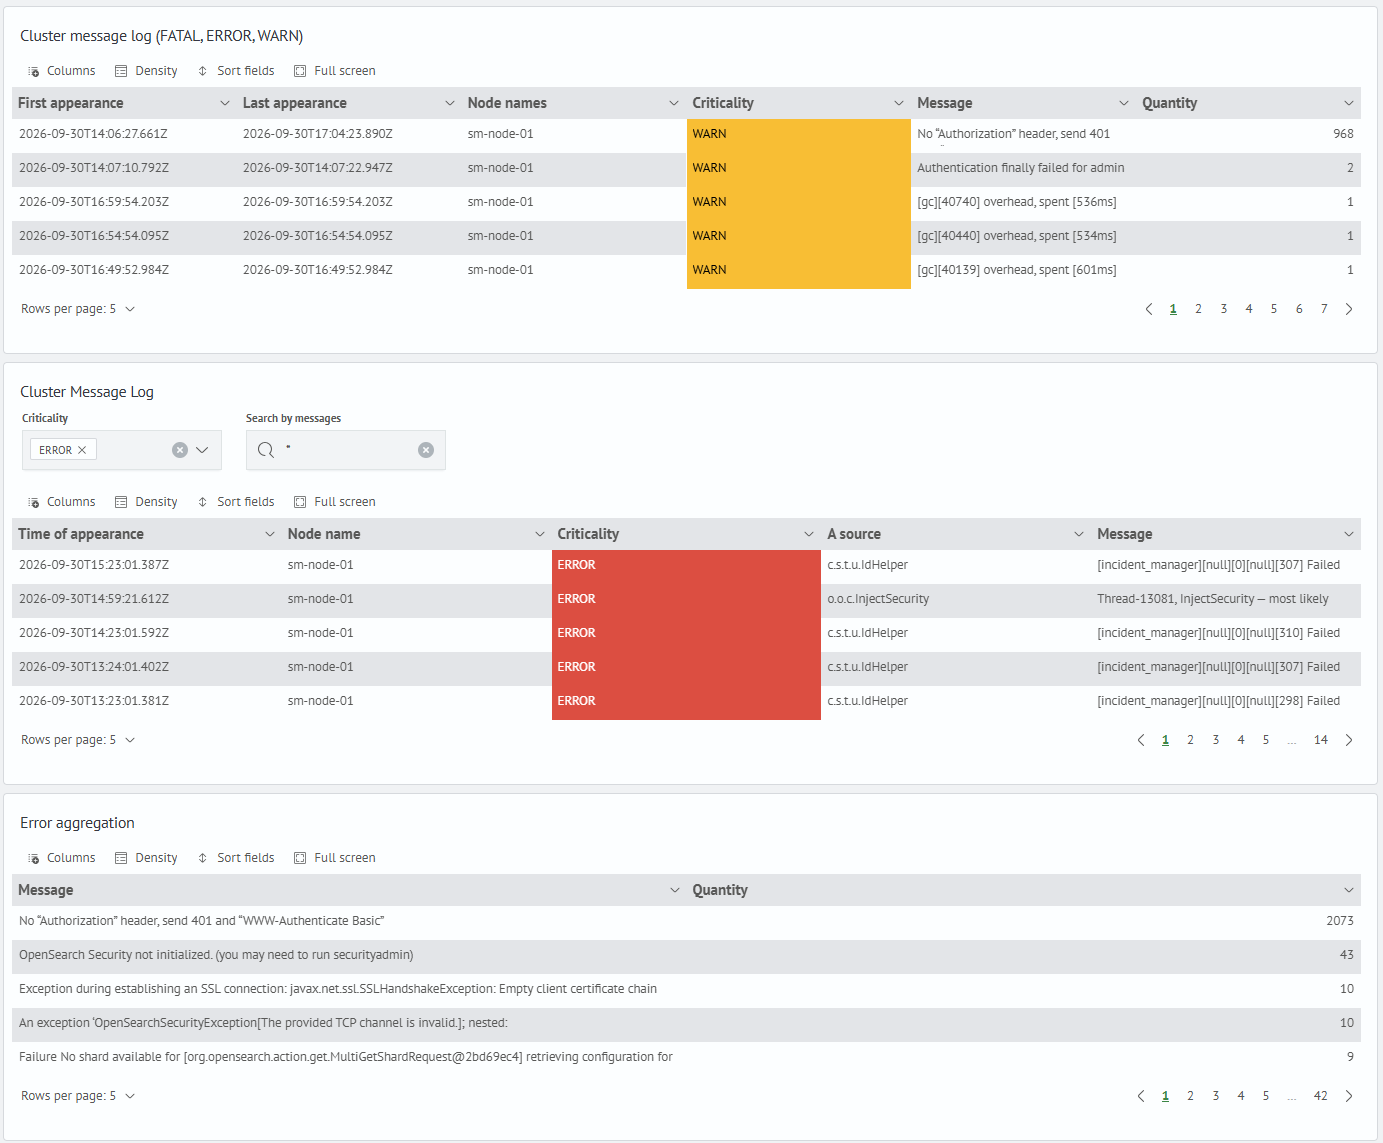
Important Messages Log | Critical and warning cluster messages. | After a status change, node loss, the appearance of unassigned shards, or write and/or search errors. |
Cluster Messages Log | Detailed cluster messages for reconstructing the event timeline. | When you need to move from a general symptom to specific messages and the time they appeared. |
Error Aggregation | Repeated messages and groups of similar errors. | When you need to assess the scale of a problem and find the most frequent messages for the selected period. |
Troubleshooting Examples
Where to Find Details
| Symptom or deviation | Where to find details |
|---|---|
| Node loss or a decrease in the number of active nodes | Node Resource Monitoring, Node JVM Monitoring |
| Unassigned shards or a change in cluster status | The current dashboard, Node Resource Monitoring |
| Disk usage or shard placement problems | Node Resource Monitoring, Node Indexing Performance Monitoring |
| Increased search load or search errors | Node Query Performance Monitoring, Cluster Query Count by Type |
| Write errors or indexing degradation | Node Indexing Performance Monitoring |
| Data collection problems | Logstash Monitoring, Logstash Node JVM Monitoring |
| Repeated errors in logs | The current dashboard: log panels and error aggregation |
Initial Assessment of Cluster State
Use the metric tables to determine which metric no longer meets the normal-operation indicators or meets the criteria for additional investigation. Record when the change occurred and compare values for the same time interval.
Determine the scope of the deviation: the entire cluster, an individual node, or shards of a specific index. If the cluster status or composition changes, proceed to the next section; for unassigned shards, proceed to shard allocation analysis; for resource deviations, proceed to the investigation of resource-related causes.
Analyzing Changes in Cluster Status and Composition
First, compare the status change with the number of active nodes and events in the logs for the same period.
The yellow status means that all primary shards are available, but some replicas are not allocated. Determine why the cluster cannot allocate the required number of replicas.
The red status means that at least one primary shard is unassigned. Some data may be unavailable, and search may return incomplete results. Determine whether the change is related to node loss, insufficient resources, allocation rules, or recovery errors.
If the number of active nodes has decreased, start by checking the availability of the affected node. If the node has returned but the shards remain unassigned, proceed to analyzing the allocation failure reasons.
Analyzing Shard Allocation
To check shard state and distribution, run a GET request in the Dev Tools console:
GET /_cat/shards?v
In the output, identify the index, shard number, replica type (p — primary shard, r — replica), state, and node where it is allocated. For a shard in the UNASSIGNED state, specify its index, number, and replica type in the body of the GET request:
GET /_cluster/allocation/explain
{
    "index": "<index_name>",
    "shard": 0,
    "primary": true
}
The primary value is true for a primary shard and false for a replica. Without a request body, the request returns an explanation for the first unassigned shard it finds.
Checking Resource-Related Causes
After identifying the affected index or shard, find the nodes in the summary table whose resource metrics changed during the same period. Compare these changes with the cluster status and shard state.
Based on the type of deviation identified, select a detailed dashboard in the Where to Find Details table and continue the investigation there.
Checking Events and Errors
After identifying the deviation and time interval, open the Important Messages Log, followed by the Cluster Messages Log. Reconstruct the timeline: when the status changed, which nodes were affected, and which messages appeared around the change.
Then use Error Aggregation to assess how often the messages recur. Compare repeated errors with the shard state and node resources: repetition alone does not explain the source of the problem.
Typical Scenarios
Node Exclusion
This scenario occurs when a node loses network connectivity with the other members or stops responding to availability checks. The cluster manager excludes it from the cluster, and the shard replicas that were located on it become unavailable.
If replicas are available, OpenSearch can promote a replica to a primary shard and recover the missing replicas on other nodes. If there are no suitable copies or sufficient resources for allocation, some shards remain in the UNASSIGNED state.
The dashboard shows this as follows:
Statuschanges toyelloworred- the
Active Nodesvalue decreases Active Shards Percentagedecreases- the number of unassigned shards changes on the
Shard Statuseschart
Consider a two-node cluster: the first node has the master + data roles, and the second node has the data role. The number of replicas is one. The node with the data role was excluded:
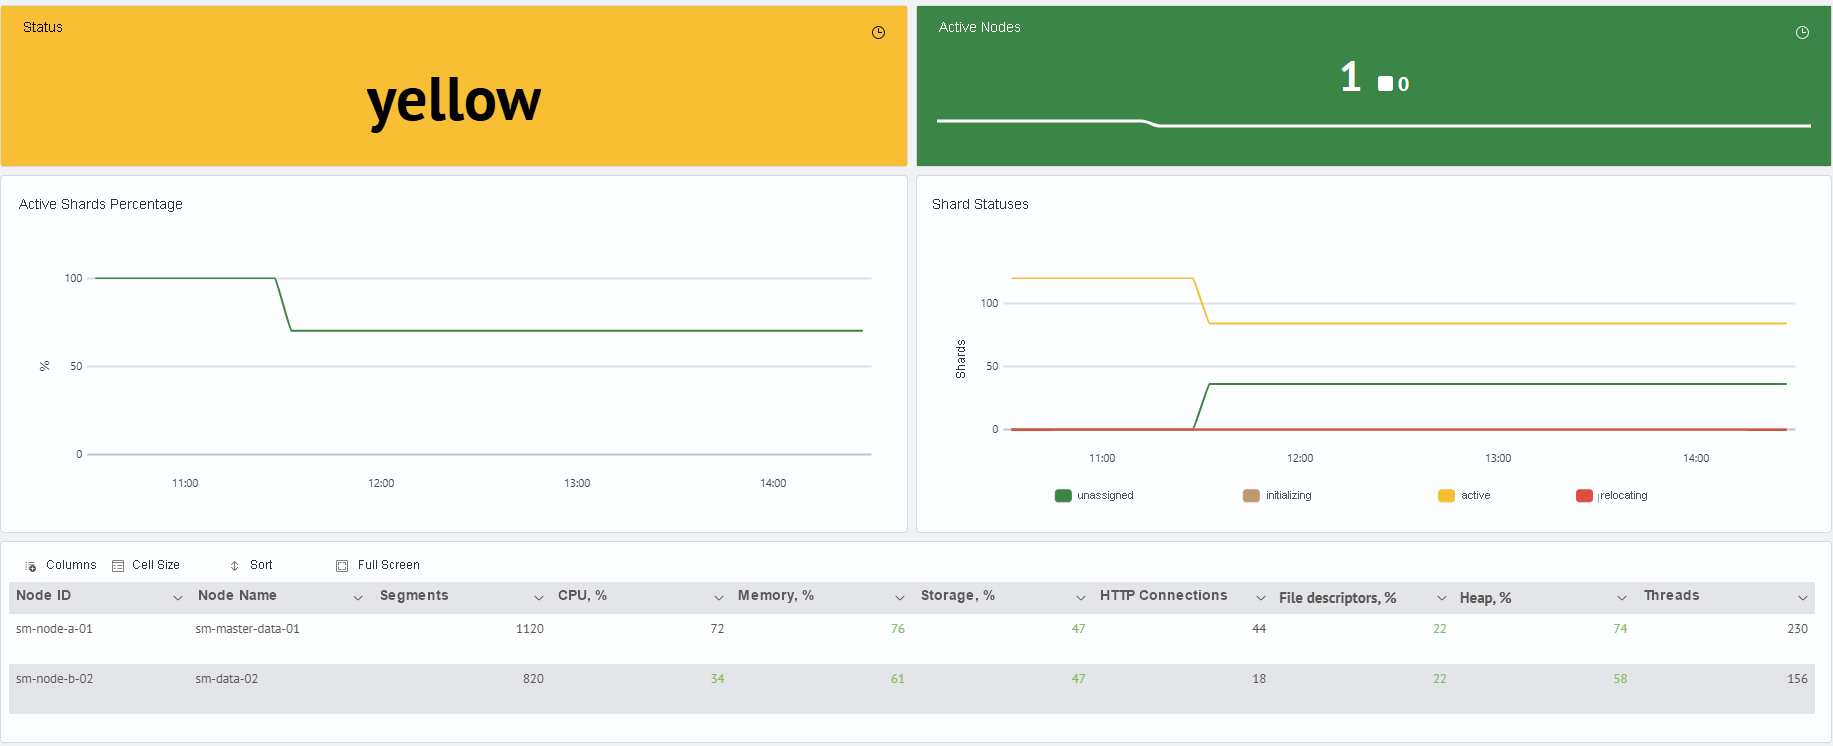
In the example, the status changed to yellow, the Active Nodes value decreased to 1, the active shards percentage decreased to approximately 70%, and some shards entered the UNASSIGNED state.
Disk Space Exhaustion
During long-term operation without configured ISM policies or with a sharp increase in incoming data volume, the available space on SA Data Storage nodes may be exhausted. The consequences depend on the disk threshold settings and on whether primary shards have become unavailable.
The dashboard shows this as follows:
Statusmay change toyelloworred- in the summary table, the
Storage, %value for one or more nodes approaches 100% - the number of unassigned shards changes on the
Shard Statuseschart
Consider a two-node cluster: the first node has the master + data roles, and the second node has the data role. The disk on the node with the data role became 100% full:
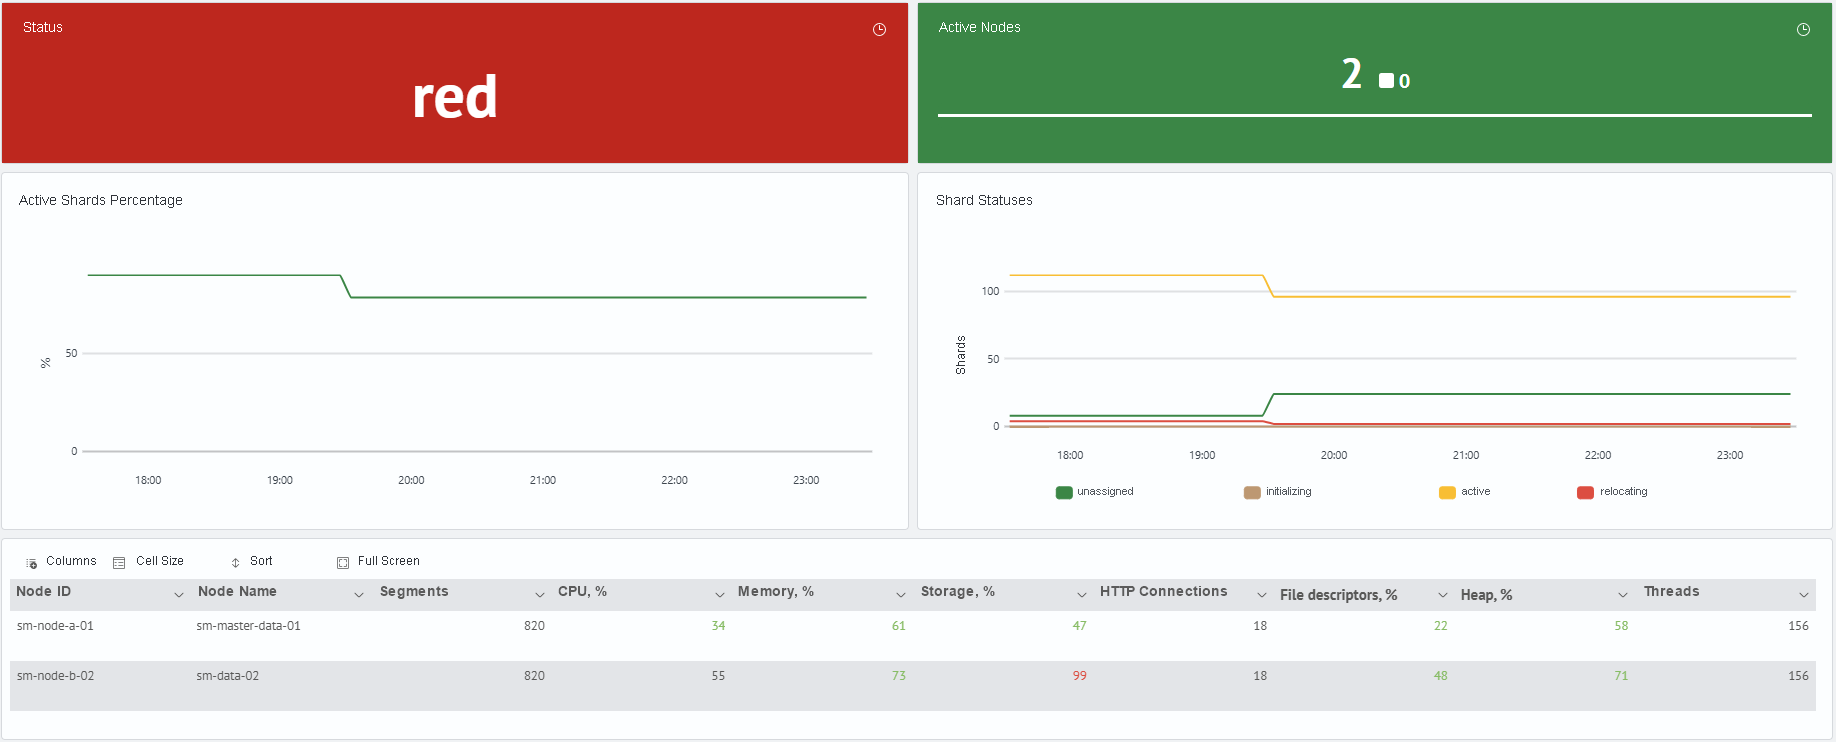
In the example, both nodes remain active, but the Storage, % value of the affected node reaches 99% in the summary table, some shards enter the UNASSIGNED state, and the status changes to red. In this case, one or more primary shards became unavailable; a full disk alone is not necessarily the cause of a red status.
In Search Anywhere Framework, disk allocation thresholds are disabled by default. If they were not enabled when the environment was configured, the cluster continues to use disk space without a protective response to the high watermark and flood_stage thresholds. When free space is exhausted, write, recovery, and shard allocation errors, node instability, and unassigned shards may occur.
For instructions on configuring Disk Watermark, see the in the corresponding article.
If shards remain in the UNASSIGNED state after space has been freed, first resolve the allocation failure reason.
To manually retry shard allocation, run the following POST request:
POST /_cluster/reroute?retry_failed=true