JVM Node Monitoring Dashboard
Article Overview
Use this dashboard to analyze JVM state on a selected Search Anywhere Framework cluster node. It helps assess thread activity, heap and non-heap memory usage, direct buffer consumption, and GC behavior.
The panels help identify signs of memory pressure, increasing thread counts, and longer garbage collection time. The dashboard does not show the direct cause of a problem, but helps determine the next diagnostic step.
Dashboard Contents
Global and Local Filters
The dashboard provides the following controls:
Periodsets the time range for viewing dataNodeselects a cluster node for analysisTime Intervalsets the resolution of time charts
Dashboard Metrics
JVM Thread Activity
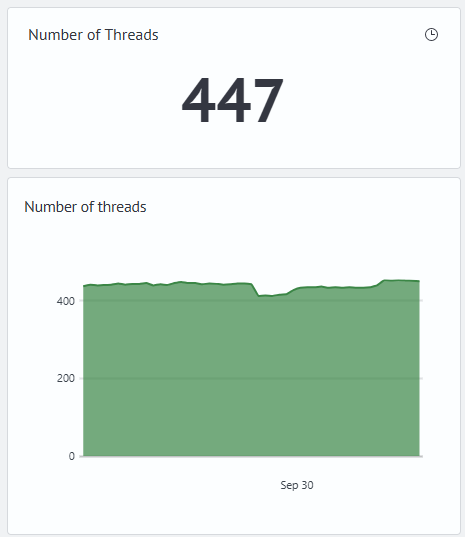
| Panel | Shows | When to Review |
|---|---|---|
Thread Count | The total number of active JVM threads on the selected node. | When latency increases, tasks may be stalled, a thread pool may be overloaded, or load may be distributed unevenly. |
Thread Count | Changes in the thread count over time. | When you need to determine whether the growth was temporary or thread activity remains above its normal level. |
Normal operation indicators: the value matches the node's usual range and returns to it after load peaks or maintenance operations.
Further investigation is needed when the metric grows consistently without a change in role, configuration, or load.
The total thread counter does not reveal thread state, names, purpose, membership in a specific thread pool, queue size, or rejection count. Therefore, treat increasing thread count as a sign for further investigation, not as an independent explanation of the cause.
Compare nodes with the same roles, similar configurations, and comparable load. In some architectures, master nodes are expected to have fewer threads than data nodes, and in a hot-warm-cold architecture, thread activity decreases from hot to cold. These relationships are not universal thresholds: roles, plugins, version, maintenance operations, and load profile affect them.
JVM Memory and Direct Buffer
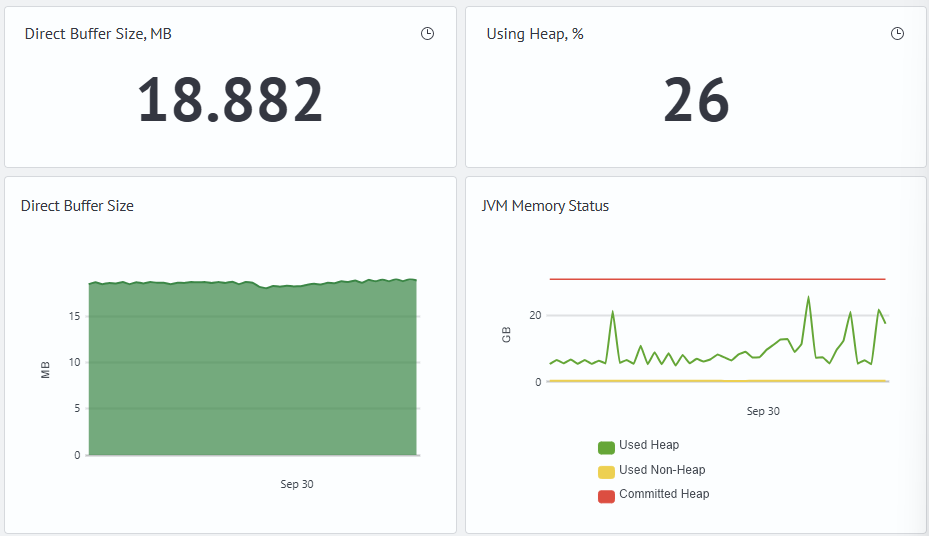
| Panel | Shows | When to Review | Normal Operation Indicators | When Further Investigation Is Needed |
|---|---|---|---|---|
Heap Usage, % | The proportion of used heap memory on the selected node. | When memory consumption grows, GC time increases, request processing errors occur, or memory shortage is suspected. | After GC cycles, used heap returns to its usual range and a margin remains before the allocated capacity. | A growing lower boundary of used heap together with increasing GC time can indicate a memory leak. |
Direct Buffer Size, MB | The amount of memory used by direct buffer outside the Java heap. | When network or file activity increases, there are many connections, or data is being snapshotted, restored, or relocated. | Consumption changes with network and file operations and stabilizes after they finish. | Compare sustained growth with connections, input/output, restoration, and process memory. |
Direct Buffer Size | Changes in direct buffer consumption over time. | When you need to determine whether growth was temporary or memory outside the heap remains allocated. | - | - |
JVM Memory State | Dynamics of used heap, used non-heap memory, and the allocated JVM heap capacity. | When checking memory pressure, working-set growth, cache effects, expensive aggregations, and behavior after GC. | Heap has a cyclic profile, while non-heap stabilizes after the JVM starts. | Compare a growing minimum heap level after GC or sustained non-heap growth with GC, load, and operating-system process memory. |
Heap is used for application objects. Non-heap includes JVM service areas, such as class metadata and the compiled-code cache. Direct buffer is memory outside the Java heap and is often associated with network or file input/output.
High heap usage or increasing direct buffer consumption does not prove a leak. Compare these signs with load, logs, cluster operations, and related dashboards.
Garbage Collector Performance
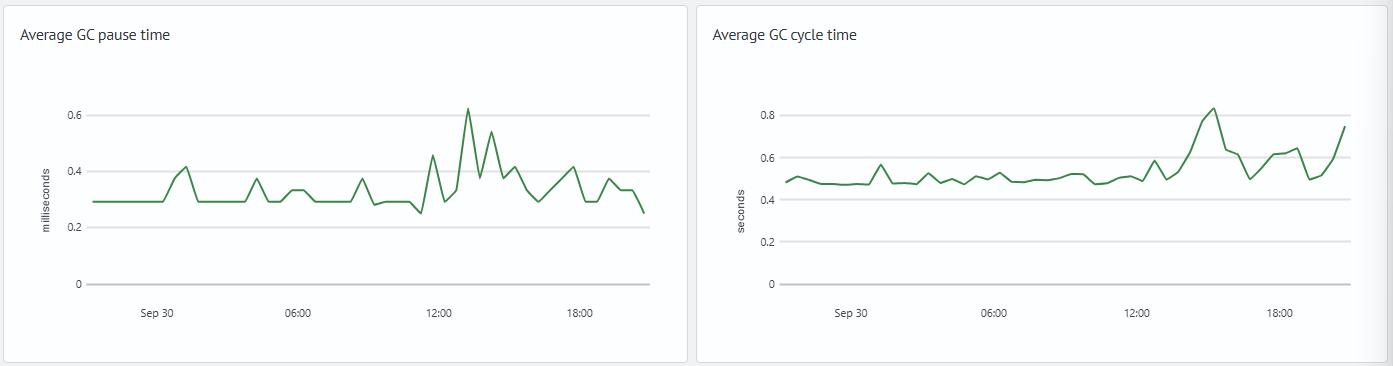
| Panel | Shows | When to Review | Normal Operation Indicators | When Further Investigation Is Needed |
|---|---|---|---|---|
Average GC Pause Time | The calculated average duration of GC pauses for the selected display interval. | When latency increases, request processing becomes unstable, or heap usage is high. | The value matches the node's usual profile and does not coincide with increased request latency. | Investigate sustained growth together with GC frequency, heap, latency, and throughput. |
Average GC Cycle Time | The calculated average duration of a garbage collection cycle. | When you need to assess whether garbage collector duration changes with load and memory consumption. | Cycle duration remains comparable under similar load. | Compare growth with heap usage, load, and events in GC logs. |
Do not equate average GC cycle time with an application pause. For collectors with concurrent phases, a significant part of a cycle can run in parallel with the application. Confirm the collection type, its phases, and the causes of long pauses in GC logs.
Problem Diagnosis Examples
Where to Find Details
| Symptom or Deviation | Where to Find Details |
|---|---|
| Growing thread count | Node Resource Monitoring: active threads, queues, rejections, and total task count by thread pool |
High heap usage or growing GC time | search and indexing load, shard count and size, segment count, number of fields in mappings, GC logs, and, when needed, a heap dump |
Growing direct buffer consumption | Node Resource Monitoring, network connections, disk input/output, snapshot operations, and restoration |
Different thread counts for master, data, hot, warm, or cold nodes | this dashboard, Node Resource Monitoring, role and shard distribution |
| Growing latency without explicit memory pressure | Query Performance Monitoring, Cluster Query Count by Type |
Initial JVM State Assessment
Start with the general sign: thread count, heap usage, or direct buffer consumption has increased, or long GC pauses have appeared. These signs help choose the diagnostic direction, but are not an independent cause of an incident.
If heap grows, first compare the memory chart with GC panels and load for the same period. If thread count grows while memory is stable, proceed to thread pool metrics. If direct buffer grows, check input/output, connections, and data maintenance operations.
Thread Activity Analysis
Use the Thread Count chart to check dynamics. Short-term growth can accompany a load peak or cluster maintenance operations. More significant signs are sustained levels above normal, stepwise growth, and differences from nodes with the same role.
For a more detailed investigation, open the Node Resource Monitoring dashboard. Review active tasks, queues, rejections, and total task count for specific thread pool instances, such as search, write, management, snapshot, and merge.
JVM Memory Analysis
Use the JVM Memory State chart together with the Heap Usage, % indicator. If used memory grows with GC time, this can indicate heap pressure. Confirm the cause with additional data: load, JVM logs, GC logs, and, when needed, a heap dump.
The heap and non-heap charts do not show object classes or retaining references. Therefore, they cannot prove a memory leak, but can identify the period and node for detailed analysis.
Heap pressure can be related to application load, shard configuration, and index mappings. The next diagnostic steps are provided in the Diagnosing Heap and GC Load section.
Direct Buffer Analysis
The Direct Buffer Size, MB and Direct Buffer Size panels help identify memory consumption outside the Java heap. Compare increasing values with network activity, file input/output, connection count, snapshot, restoration, and shard relocation.
One panel cannot identify buffer ownership or confirm a leak outside the heap. If growth is sustained, review related node resource metrics and logs for the same period.
GC Analysis
Use the Average GC Pause Time and Average GC Cycle Time panels together with the memory chart and load metrics. Growing pause time is important when it coincides with request latency or periods of high heap usage.
Diagnosing Heap and GC Load
If growing heap usage coincides with increasing GC time, first compare that period with search and indexing load. Check CPU utilization, request latency, queues, and thread pool rejections. Then compare the node with other nodes that have the same role and configuration. A difference on one node can result from uneven shard placement or request routing.
If application load does not explain the JVM metric changes, check shard count and size, segment count, and index mappings. If memory keeps growing and is not released after GC, also analyze GC logs and a heap dump.
Checking for Oversharding
Each shard is a separate Lucene index and uses memory for its own structures and segments. A large number of small shards increases permanent heap and CPU overhead. Search requests are distributed across more shards, while refresh, merge, restoration, and relocation run for each shard separately.
High heap usage, increasing GC time, and moderate user load together can indicate possible oversharding. To investigate, compare shard count across nodes, primary shard and replica size, segment count, and the number of small indices. This dashboard alone cannot confirm oversharding.
If the cluster contains many small shards:
- adjust new index templates and the primary shard count to the expected data volume
- review
rolloverconditions if new indices are created too often - merge small indices with
reindexif retention periods and the access pattern allow it - consider
shrinkfor indices that have been made read-only - delete indices whose retention period has expired
- review the required replica count according to availability and search-load requirements
There is no universal permissible number of shards per node. It depends on heap capacity, shard size, segment count, and load profile. You cannot reduce the number of primary shards in an existing index by changing a regular setting: use a new index followed by reindex, or use shrink.
Checking Index Mappings
A mapping with many fields increases metadata volume and memory consumption. With dynamic mapping, documents with variable keys can continuously create new fields. This increases JVM load and can cause more frequent GC.
Check which indices contain the largest number of fields and whether the count continues to grow. Ensure that identifiers, dates, and other variable values are not used as field names. Use explicit mappings and dynamic templates for data with a predictable structure. Exclude unnecessary fields at data ingestion. If an existing index mapping must be changed, create a new index and transfer data using reindex.
For JSON objects with a large or unknown set of keys, consider the flat_object type. It stores an object without creating a separate mapping field for every nested key. This option is appropriate when object content is mainly retrieved from the document and nested values are not used for typed search, sorting, and aggregations.
flat_object is not a universal replacement for a standard object. Nested values do not have their own types, and query capabilities for them are limited. Before changing the mapping, review the queries, visualizations, and reports that use these fields. If a field is not used at all, excluding it at data ingestion is preferable.
Typical Scenarios
Signs of Heap Pressure
This scenario shows simultaneous growth in used heap and calculated GC time.
The dashboard displays the following signs:
- the
Heap Usage, %indicator shows high memory usage for a long time - the used
heapseries on theJVM Memory Statechart grows and approaches the allocated capacity Average GC Pause TimeorAverage GC Cycle Timegrows during the same period
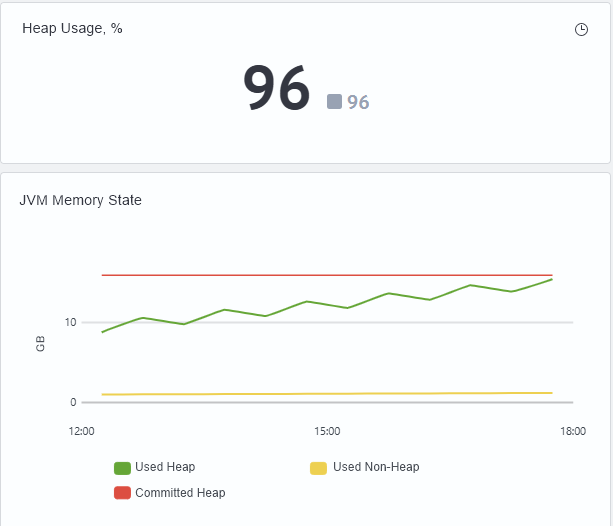

In the images, used heap gradually approaches the available JVM capacity while calculated GC time increases. This pattern indicates increasing memory pressure.
To find the cause, use the sequence in the Diagnosing Heap and GC Load section: first check application load, then shard and mapping configuration, then, if necessary, proceed to GC logs and a heap dump.
The dashboard does not show object classes or retaining references. Confirming a memory leak requires additional data, such as a heap dump and object analysis.
Growing Thread Count on a Node
Growing total thread count can accompany increased load or cluster maintenance operations. A sustained deviation from the normal level requires investigation, especially when it cannot be explained by known load during the same period.
The dashboard displays the following signs:
- the
Thread Countindicator shows an elevated value relative to the selected node's normal level - the
Thread Countchart shows growth or a sustained elevated level - memory and
GCmetrics can remain stable
The image shows that thread count on the selected node grows for several intervals and remains above the previous level. This pattern confirms a growth in the total number of active threads, but does not show which threads or pools caused the increase.
Open the Node Resource Monitoring dashboard and review active tasks, queues, rejections, and total task count for the required thread pool during the same period. Also compare the change with search, indexing, snapshot, restoration, relocation, and merge.
When comparing nodes with different roles, consider the cluster architecture. Master nodes are usually expected to have lower thread load than data nodes, and in a hot-warm-cold architecture, thread activity often decreases from hot to cold. These relationships help identify load imbalance, but draw the final conclusion from the node baseline and related metrics.