Logstash Node JVM Monitoring Dashboard
Article Overview
Use this dashboard to analyze the Logstash JVM process on a selected node. It shows heap and non-heap memory use, active JVM thread count, and garbage-collection time.
The panels help identify memory pressure, increased thread activity, and possible GC impact on event processing. They show symptoms and investigation direction but do not replace analysis of Logstash logs, pipeline state, queues, and receiving systems.
Dashboard Contents
Global and Local Filters
Timelimits the analysis time rangeNodefocuses analysis on a specific Logstash nodeTime Intervalcontrols chart granularity
Dashboard Metrics

Top JVM State Indicators
Use the top indicators for an initial assessment of threads, memory, and GC.
| Panel | What It Shows | When to Investigate |
|---|---|---|
| "Thread Count" | Current number of active JVM threads. | Investigate sustained changes with CPU, latency, backpressure, and thread-creation errors. |
| "Heap Usage, %" | Current proportion of used JVM heap. | Investigate shrinking headroom, increased Old GC duration, throughput degradation, queues, OutOfMemoryError, or restarts. |
Thread and Memory Trends

| Panel | What It Shows | When to Investigate |
|---|---|---|
| "Thread Count" | Active JVM thread count over time. | Investigate sustained growth at comparable load with CPU, context switches, pipeline delay, and backpressure. |
| "JVM Memory State" | Used heap, committed heap, and used non-heap memory. | Investigate a rising post-GC heap baseline or sustained non-heap growth. |
The JVM Memory State panel typically includes used heap, committed heap, and used non-heap. Non-Heap is not all Logstash process memory outside the heap. When operating-system or container memory rises while these values remain stable, also investigate native memory, direct buffers, mmap, file operations, and runtime limits.
Garbage Collector Performance

| Panel | What It Shows | When to Investigate |
|---|---|---|
| "Average OLD GC Cycle Time" | Average old-generation garbage-collector duration. | Investigate repeated growth with a higher post-GC heap baseline, queue growth, throughput degradation, errors, or restarts. |
| "Average Young GC Cycle Time" | Average young-generation garbage-collector duration. | Investigate sustained growth at comparable load or coincident throughput decline and queue growth. |
Young GC growth is often related to intensive short-lived object allocation. Old GC growth can indicate a memory leak, retained large objects, queues, retry/backoff in output plugins, or insufficient heap headroom.
Problem Diagnosis Examples
Where to Find Details
For heap growth, check this dashboard, Logstash logs, pipeline configuration, queue and batch settings. For Young GC growth, use Logstash Monitoring, filter configuration, and input volume. For operating-system or container memory growth, use Node Resource Monitoring and inspect native memory and direct buffers.
Initial JVM Assessment
Start with heap usage and active thread count. Determine whether the change is a temporary spike or sustained trend. Simultaneous heap and Old GC growth suggests memory pressure; thread growth without notable heap growth can be related to load, external waits, locks, or pipeline settings.
Memory, Thread, and GC Analysis
Assess JVM memory using several metrics together. Used heap shows memory occupied by objects, committed heap is memory available to the JVM at the measurement time, and non-heap covers JVM memory outside heap but not all operating-system process memory.
Thread count is an indirect signal and does not identify a thread state, a specific pipeline, a lock, or a stalled operation. Use Logstash Monitoring for Hot Threads analysis.
Evaluate Young GC and Old GC with heap and Logstash load. If Young GC grows while heap returns to its usual range, allocation profile or a temporary load spike is more likely. If Old GC and heap use continue to grow, investigate sustained object retention.
Typical Scenarios
Signs of Sustained Heap Growth
The dashboard can identify sustained heap growth but cannot prove a memory leak by itself. Growth may be caused by retained objects, higher load, queued events, plugin behavior, or delays in external receiving systems.
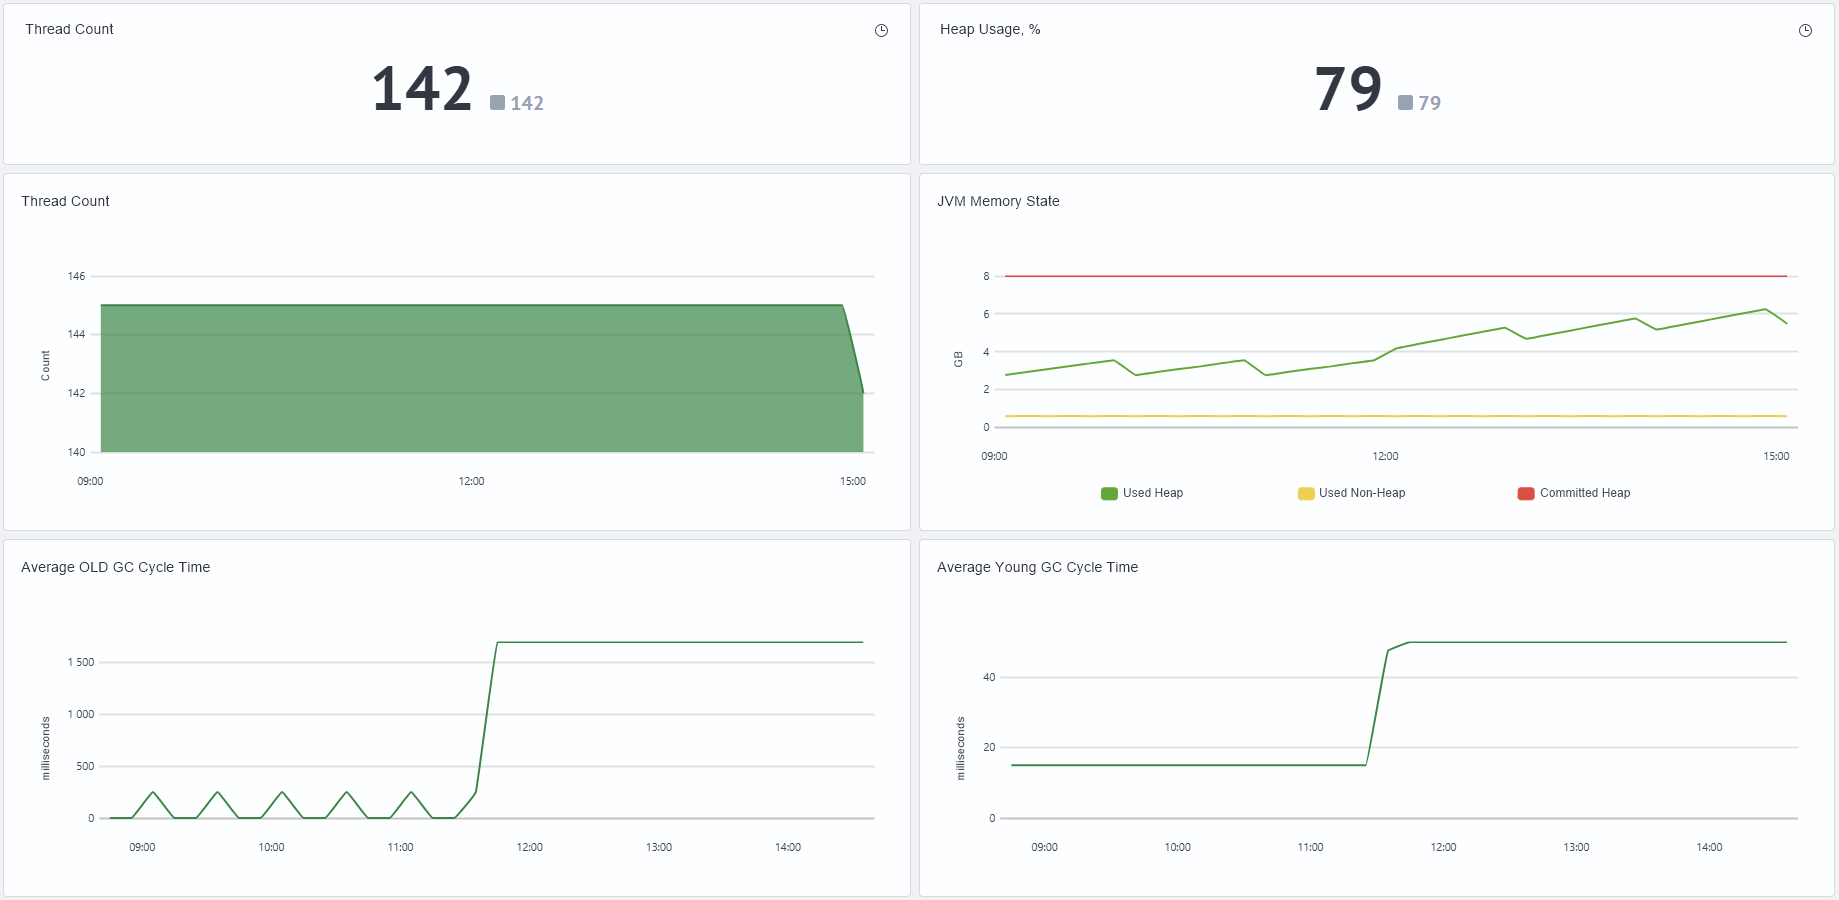
Correlate increasing heap use and Old GC time with pipeline configuration, filters, output plugins, queues, event size, and external-system write errors. Confirming a memory leak requires separate memory analysis.
Increasing Young GC and Old GC Cycle Time
This scenario occurs when the JVM spends more time in garbage collection. It may be caused by normal load growth, heavy event processing, many temporary objects, or retained data in memory.
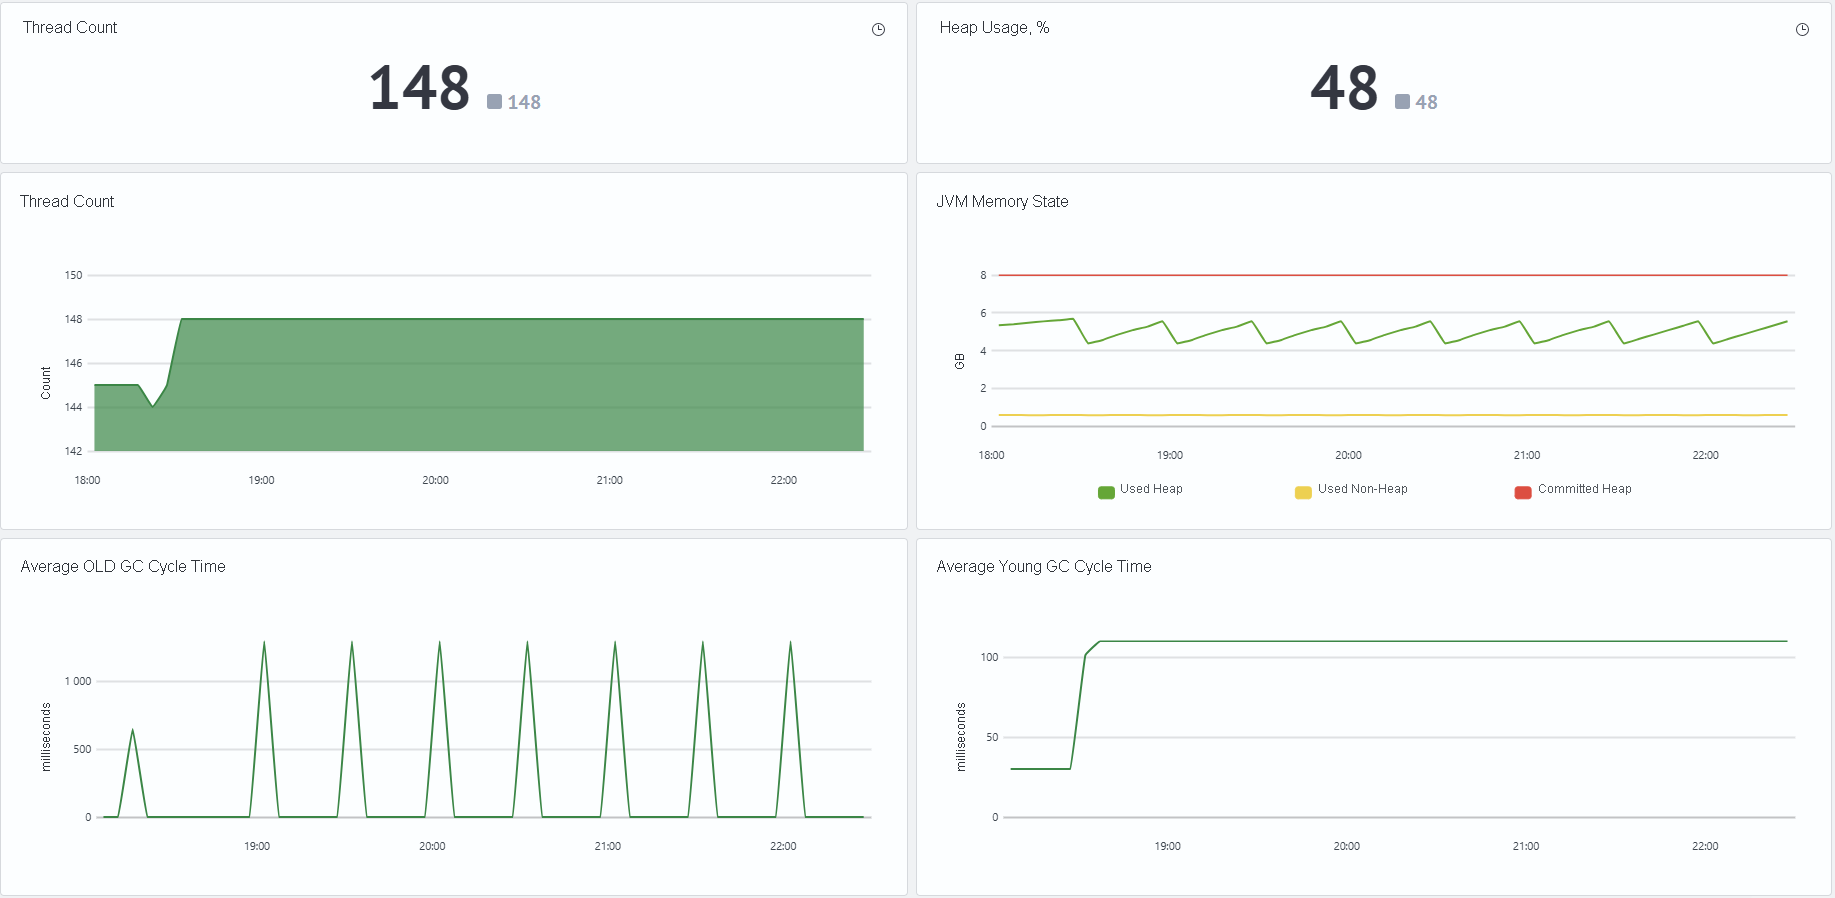
If Young GC grows, check input volume, heavy filters, string conversion, JSON/XML parsing, and batch processing. If Old GC grows, investigate queues, large events, retry/backoff in output plugins, caches, and custom filters. Correlate GC growth with pipeline changes, queue state, and output-plugin errors.