Indexing Performance Monitoring Dashboard
Article Overview
Use this dashboard to analyze indexing performance in a Search Anywhere Framework cluster. It shows write operations, failed indexing, periods of indexing throttling, and internal index operations: merge, refresh, and flush.
The panels help identify periods in which metrics change and determine the next diagnostic step. This dashboard alone cannot determine the exact cause of write errors, indexing latency, or storage overload. Confirm conclusions with logs, request responses, shard state, and node resource metrics.
Dashboard Contents
Global and Local Filters
The dashboard provides the following controls:
Periodsets the time range for viewing dataNodeselects a cluster node for detailed analysisTime Intervalsets the resolution of time charts
Dashboard Metrics
Write Operational State

| Panel | Shows | When to Review | Normal Operation Indicators | When Further Investigation Is Needed |
|---|---|---|---|---|
Failed Indexing | The number of indexing operations that failed while writing data through the User -> index and Search Anywhere Framework plugin -> index flows. | When the counter increases, review indexing request responses, user or Search Anywhere Framework plugin logs, and the target index state. | The counter does not increase. A stable non-zero value can refer to errors that occurred earlier. | Any increase indicates new failed operations. |
Indexing Throttling, Seconds | The time during which indexing was rate-limited. | When write latency increases, merge or flush operations are active, or the write path may be overloaded. | The metric does not increase, or short-term throttling does not violate write requirements. | Sustained growth together with longer indexing time or lower output flow can indicate a write-path limitation. |
Active Merges | The number of merge operations running on the node. | When you need to determine whether background segment activity can compete for resources. | Activity matches the write volume and completes without a prolonged decline in indexing and search performance. | Investigate growth if it coincides with higher disk load, memory consumption, indexing time, or queue length. |
Merge Memory Usage, MB | The amount of memory used by merge operations. | During high merge activity, growing memory consumption, or degraded write operations. | - | - |
Indexing Flow and Latency
| Panel | Shows | When to Review | Normal Operation Indicators | When Further Investigation Is Needed |
|---|---|---|---|---|
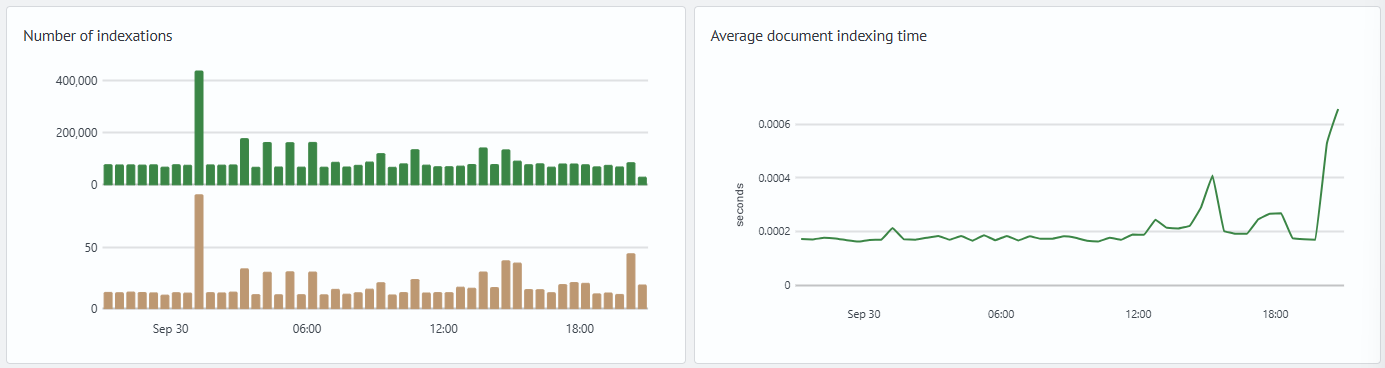
Indexing Count | The number of indexing operations performed by the cluster and their associated time cost. | When assessing indexing dynamics and comparing them with the event ingestion rate for the same period. | The cluster processes the incoming flow without accumulating a backlog. | The indexing rate is consistently lower than the event ingestion rate, or processing time grows under comparable load. |
Average Document Indexing Time | The calculated duration of one indexing operation. | When write latency increases. Compare this metric with the number of operations, document size, throttling, and node resources. | The value meets write requirements and matches the typical document profile under comparable load. | Compare sustained growth with document size, queues, and shard state. An average can conceal individual slow operations. |
Errors and Throttling Over Time
| Panel | Shows | When to Review |
|---|---|---|
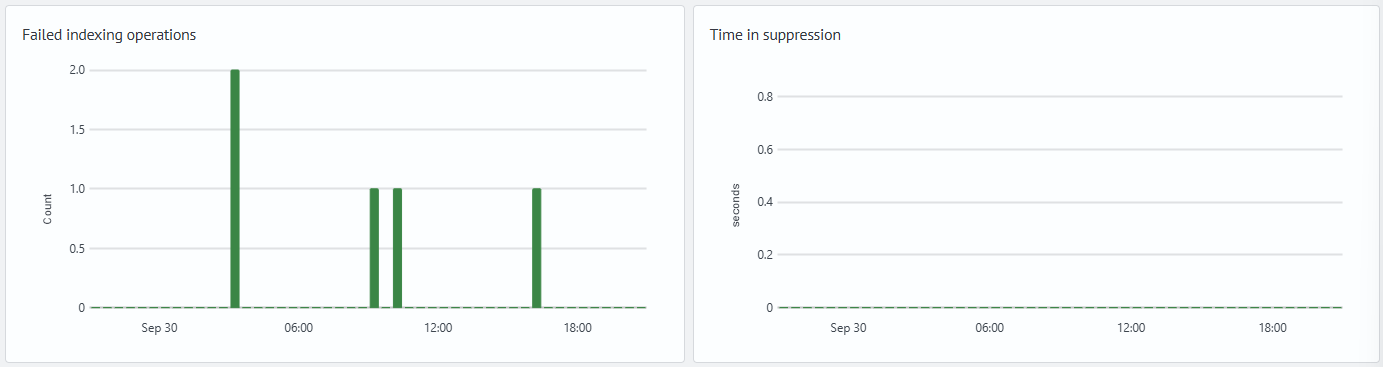
Failed Indexing | The distribution of indexing errors over time. | When you need to determine when an error occurred and review indexing request responses, initiator logs, and the target index state. |
Throttling Time | The distribution of throttling periods over time. | When you need to determine the periods in which the node limited indexing and correlate them with resources and internal operations. |
Internal Index Operations
| Panel | Shows | When to Review |
|---|---|---|
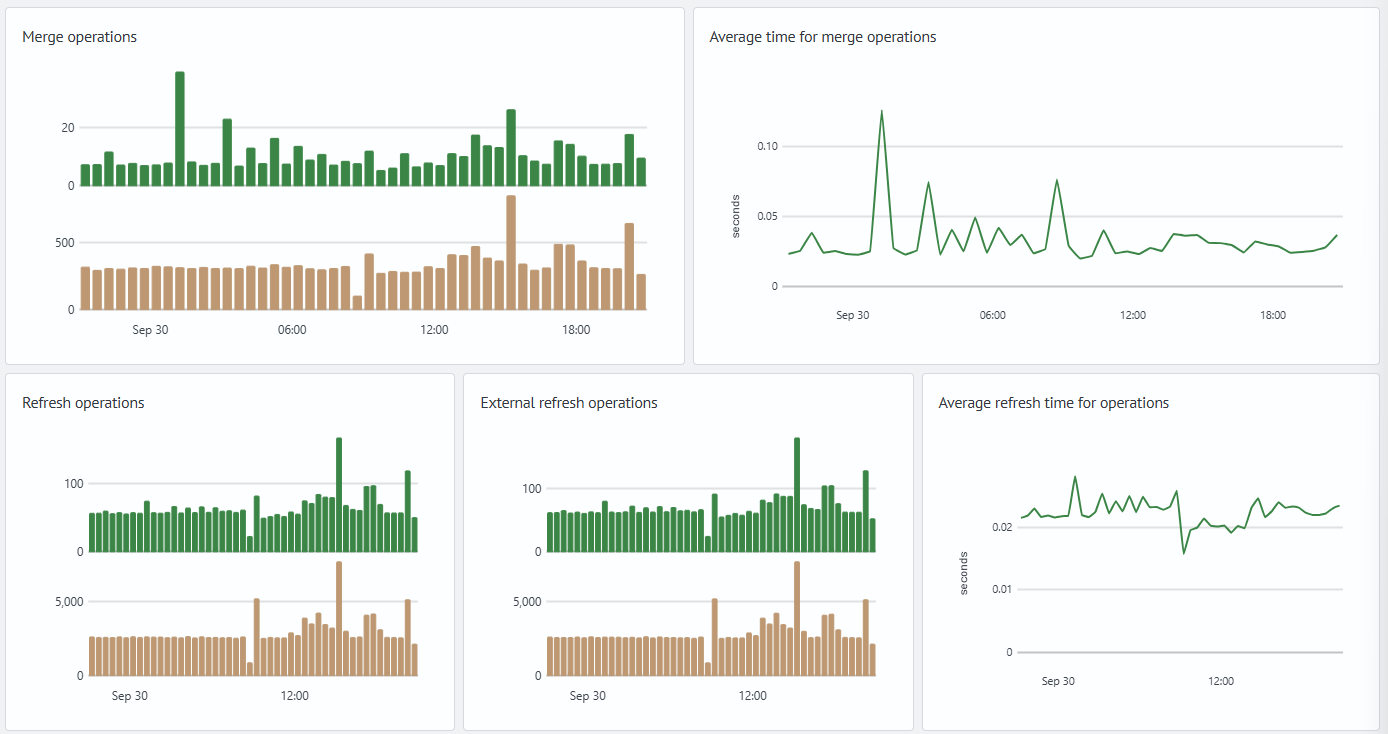
Merge Operations | The number and duration of segment merge operations. | When write latency increases, background operations are active, or disk-resource contention is suspected. |
Average Merge Operation Time | The calculated duration of one merge operation. | When you need to assess the merge duration trend and correlate it with write activity, search, and storage. |
Refresh Operations | Operations after which recently indexed documents become visible to search. | When data visibility in search is delayed, the number of small segments grows, or search load is high. |
External Refresh Operations | A separate class of refresh operations that the metrics source identifies as external, if the dashboard contains this panel. | When you need to determine whether the load is related to frequent requests for immediate data visibility. |
Average Refresh Operation Time | The calculated duration of a refresh operation. | When data visibility latency or search load increases, or the write mode changes. |
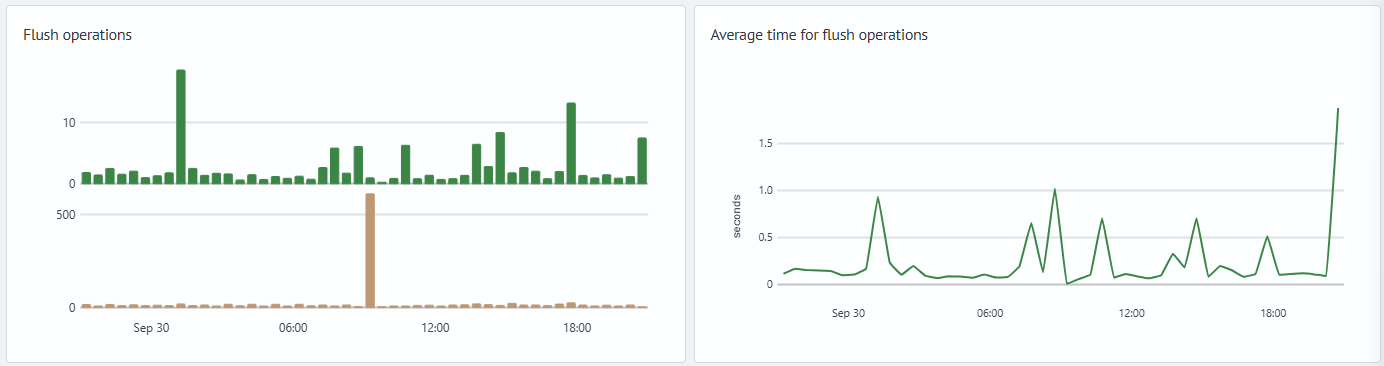
Flush Operations | Operations that commit changes and maintain translog. | When assessing the effect of writes, fsync, storage utilization, and merge operations. |
Average Flush Operation Time | The calculated duration of one flush operation. | When write time grows consistently or there are signs of storage issues. |
Problem Diagnosis Examples
Where to Find Details
| Symptom or Deviation | Where to Find Details |
|---|---|
| Growing failed indexing count | indexing request responses, user or Search Anywhere Framework plugin logs, target index state, Cluster Health |
| Growing throttling time | Node Resource Monitoring, the merge and flush sections of this dashboard |
| Growing average indexing time | this dashboard, Node Resource Monitoring, Logstash Monitoring |
| Write errors together with a changed cluster state | Cluster Health |
| Disk utilization or shard allocation issues | Cluster Health, Node Resource Monitoring |
| Signs of ingest-flow issues | Logstash Monitoring, Logstash Node JVM Monitoring |
Initial Indexing Assessment
Start with the top indicators: determine whether failed indexing is present, indexing throttling time is accumulating, and active merge operations are running. These signs help choose the diagnostic direction, but do not independently explain the cause.
If the failed indexing counter grows, identify the operation initiator and review write request responses, user or Search Anywhere Framework plugin logs, and the state of the target index and its shards. If there are no errors but throttling time and indexing latency are growing, proceed to the analysis of internal index operations and node resource metrics.
Indexing Error Analysis
In the context of this dashboard, failed indexing means a write operation error through the User -> index or Search Anywhere Framework plugin -> index flow. The panel shows the fact and time of the counter increase, but not the cause of the error. Find the cause in write operation responses, initiator logs, and the state of the target index for the same period.
Typical investigation areas:
- data and mapping: a document may not match the index schema because of an incorrect field type, an invalid date, a parsing error, or a template conflict
- ingest pipeline: an error can occur during document transformation, such as JSON parsing, date parsing, a grok pattern, required fields, or custom logic
- shard state: a write can fail if the required primary shard is unavailable, the index is closed, or allocation restrictions are in place
- cluster limits: check index blocks, disk limits, circuit breakers, and rejected tasks in write pools
Latency and Throttling Analysis
Throttling indicates that indexing was rate-limited. This metric is not the number of errors and does not explain the cause of the limitation. Compare it with the number of indexing operations, average processing time, merge activity, flush time, and node resources.
If throttling increases without a growth in errors, this is more likely to indicate slower processing than a write failure. If throttling coincides with errors, check whether node resources are exhausted or tasks are being rejected in write pools.
Analysis of Internal merge, refresh, and flush Operations
Merge combines index segments. The operation reads existing segments and writes new ones, so at high activity it can compete for resources with indexing, search, and flush. A long-running merge is not always an error: assess it by its trend and in relation to node load.
During refresh, the engine makes recently indexed documents visible to search. This is a near-real-time operation: a document can be successfully accepted for indexing before it becomes available to search queries.
Do not confuse refresh with flush. Refresh updates the index search view and controls data visibility in search. Flush commits changes and maintains translog.
If the dashboard separates general and external refresh operations, use this as an additional signal. A frequent increase in external refresh operations can be associated with requests for immediate data visibility, but logs, tracing, or application data are required to identify the specific initiator.
Compare increasing flush time with write activity, fsync, storage utilization, and merge activity.
Typical Scenarios
Failed Indexing Growth
This scenario occurs when the failed indexing counter increases during the selected time interval.
The dashboard displays the following signs:
- the
Failed Indexingcounter increases during the selected interval - the
Failed Indexingchart shows the period in which errors grow Indexing Countcan show that write operations continue to runThrottling Time,Average Flush Operation Time, andAverage Merge Operation Timeprovide additional context, but do not determine the cause of errors without logs and request responses
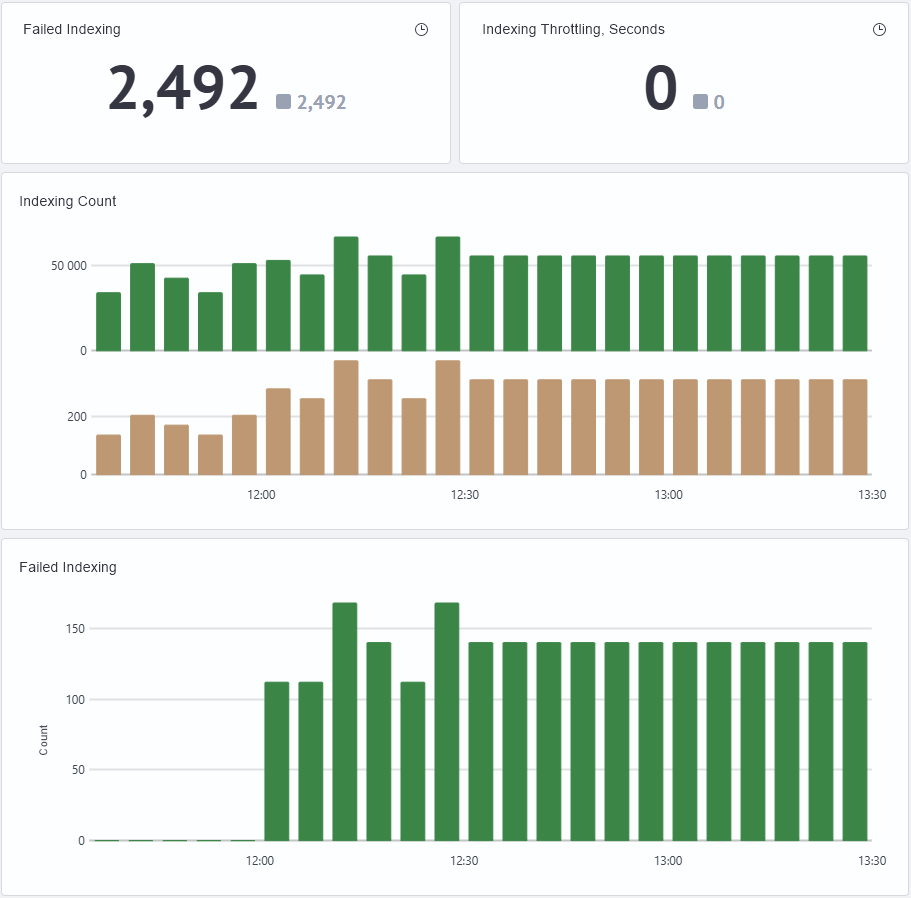
The example shows a growth in failed indexing operations without a simultaneous increase in throttling time. This distinguishes a write error from indexing rate limiting, but does not identify the cause of the failure. For diagnosis, review bulk and index responses, shard state, and related cluster-side errors.
Indirect Signs of Write-Path Overload
This scenario occurs when the dashboard shows signs of slower indexing: throttling time increases, average processing time grows, or background index operations are active at the same time. These signs indicate the direction of further investigation, but do not confirm a specific cause without resource metrics and cluster state.
The dashboard displays the following signs:
Indexing Throttling, SecondsandThrottling Timeshow non-zero valuesAverage Flush Operation Timegrows consistentlyAverage Document Indexing Timegrows with a comparable number of indexing operationsAverage Merge Operation Time,Active Merges, andMerge Memory Usage, MBshow background segment merge activity
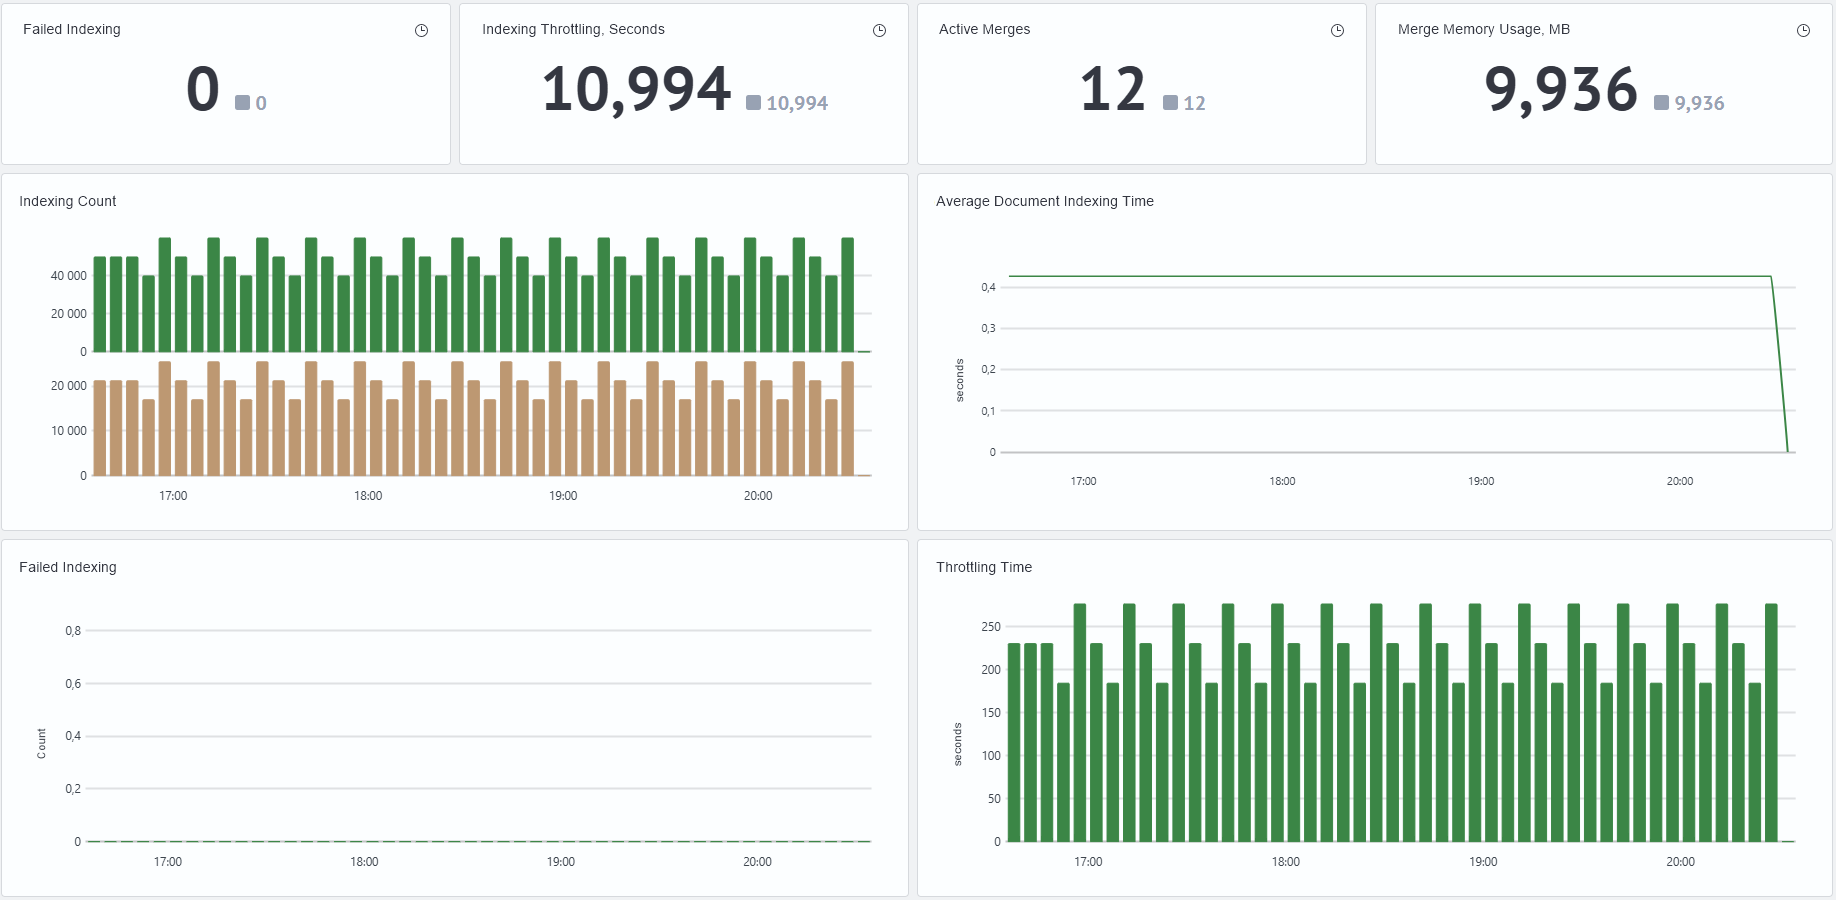
The example shows non-zero throttling time and merge activity. This pattern indicates the direction of further investigation, but requires confirmation with resource metrics and cluster state.
For these signs, open the Node Resource Monitoring dashboard and compare them with read, write, storage utilization, and queue charts. If there are signs of disk utilization issues, review shard state and disk allocation logic in Cluster Health.