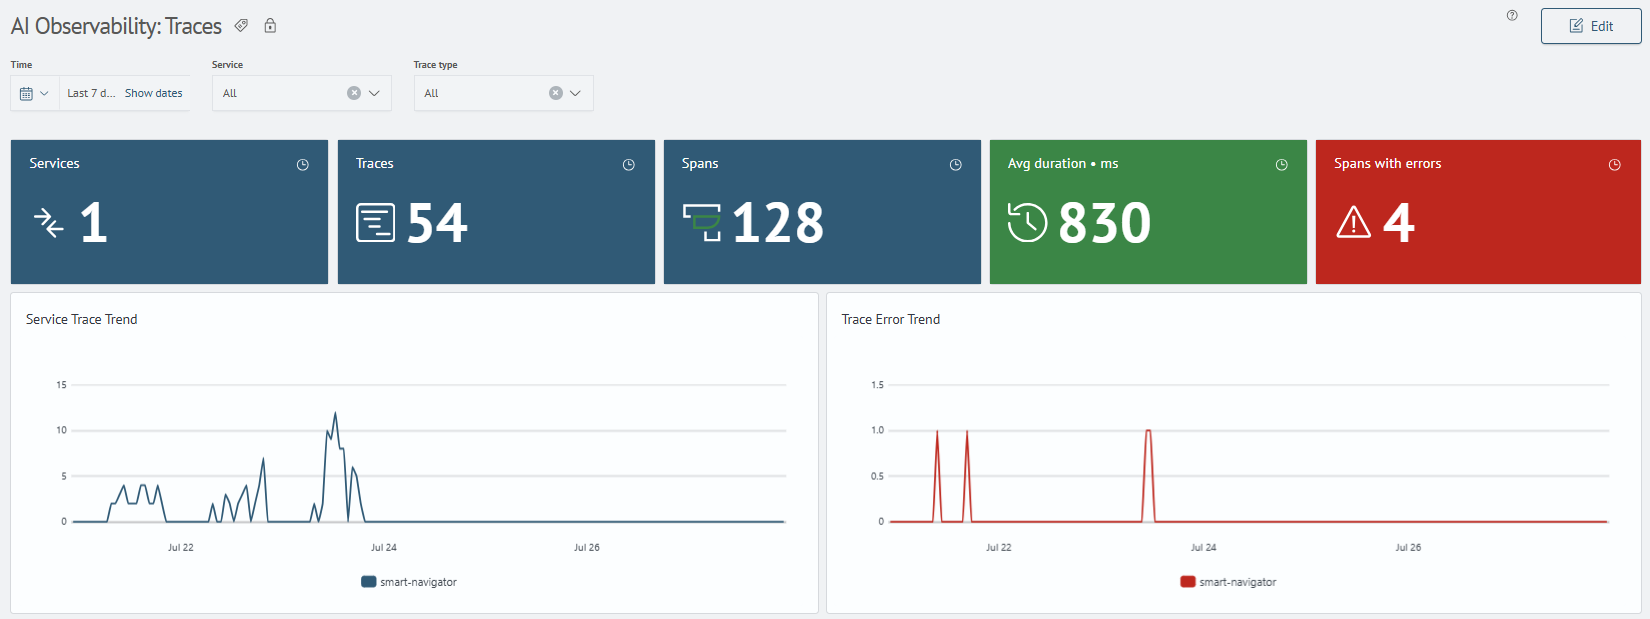
AI Observability: Traces
The AI Observability: Traces dashboard is designed for analyzing AI request traces.
It allows studying the structure and behavior of requests at the level of individual spans: agent steps, LLM calls, and tools.
Useful for: AI agent developers, debugging engineers, performance specialists.
Data source: gen_ai_traces*
Main Sections
1. Traces Summary and Operation Activity
Shows key indicators for traces, spans, and AI service operations:
- number of services, traces, and spans
- average trace duration
- number of spans with errors
- trace dynamics by services
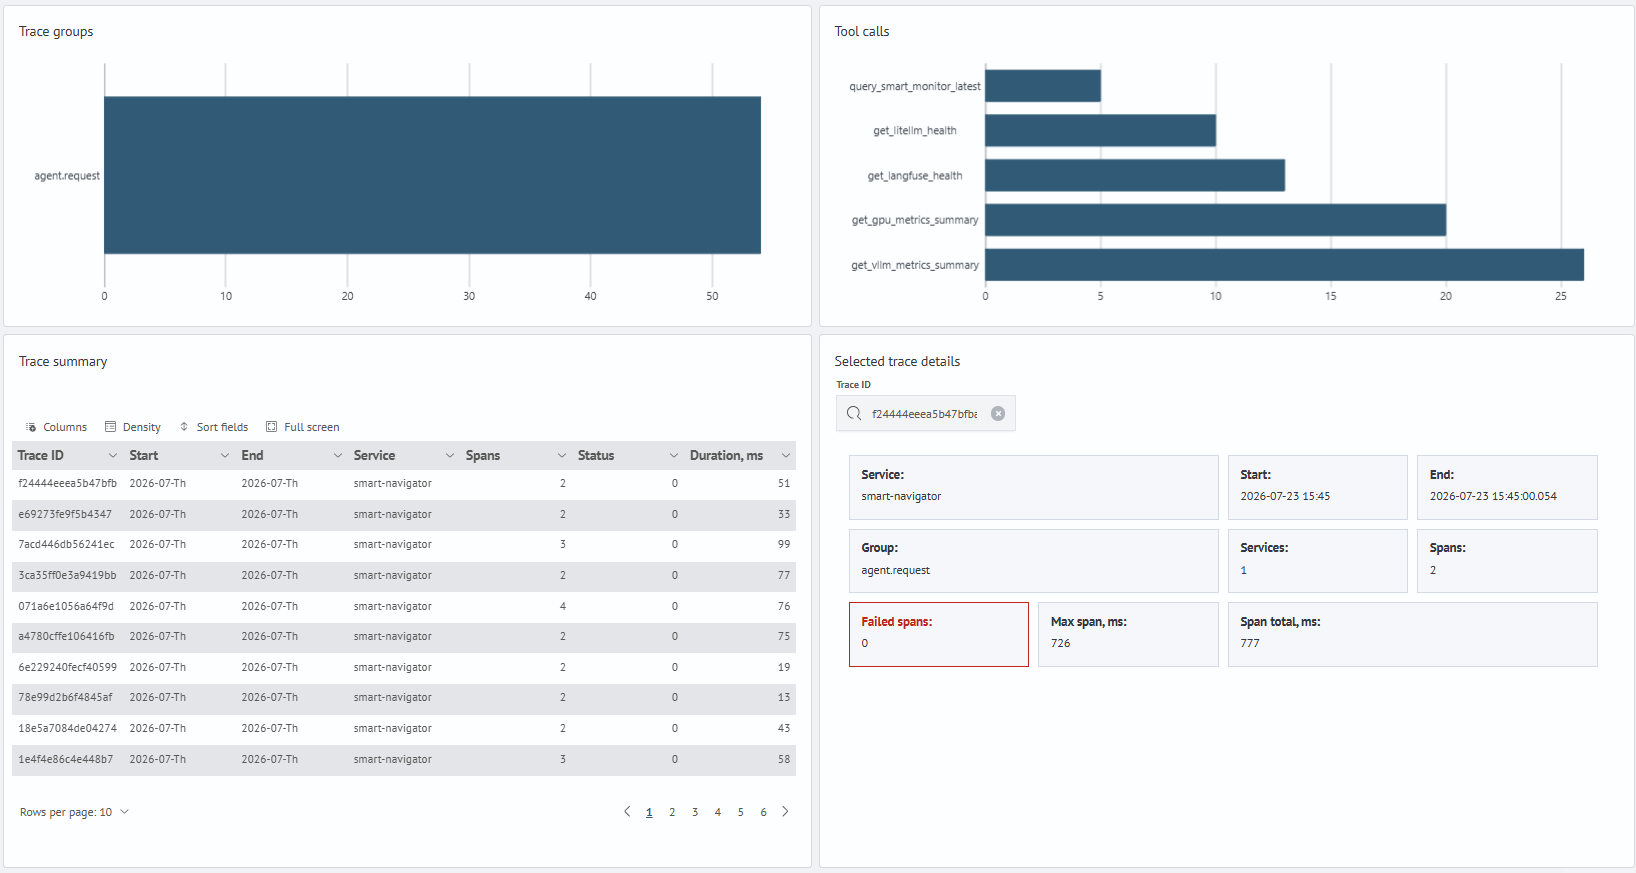
- distribution of traces and tool calls by operation groups
2. Traces Summary
Shows a table of traces for the selected period and allows transitioning to details of a specific trace:
- trace identifier
- start and end time
- trace source service
- number of spans and errors
- trace execution duration
Drilldown is available in the table: when selecting a trace, the Trace Details and Trace Map panels hidden by default open.
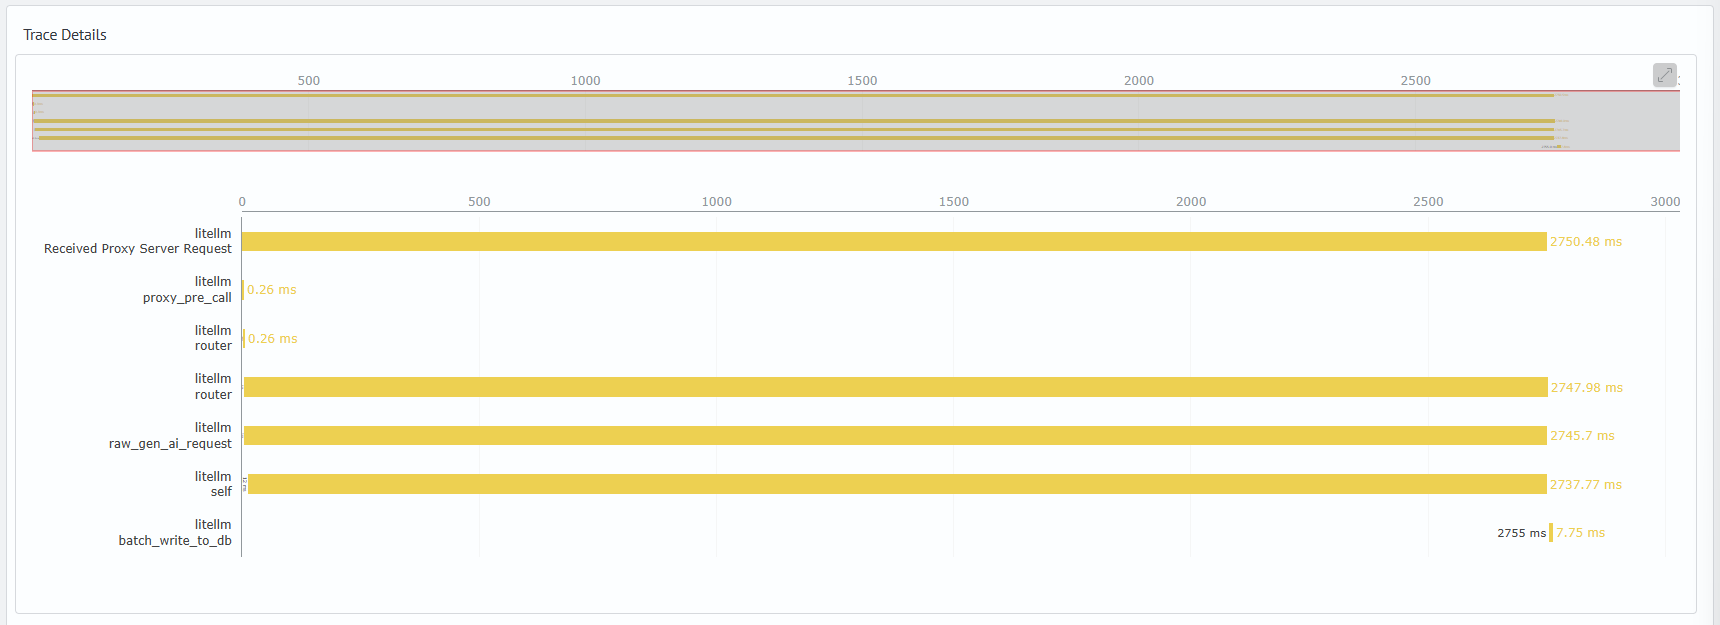
3. Trace Details
Shows detailed information about the selected trace and its spans:
- general parameters of the selected trace
- list of spans and their duration
- services and operations within the trace
- execution statuses and errors
The panel is displayed after selecting a trace in the Traces Summary table.
4. Trace Map
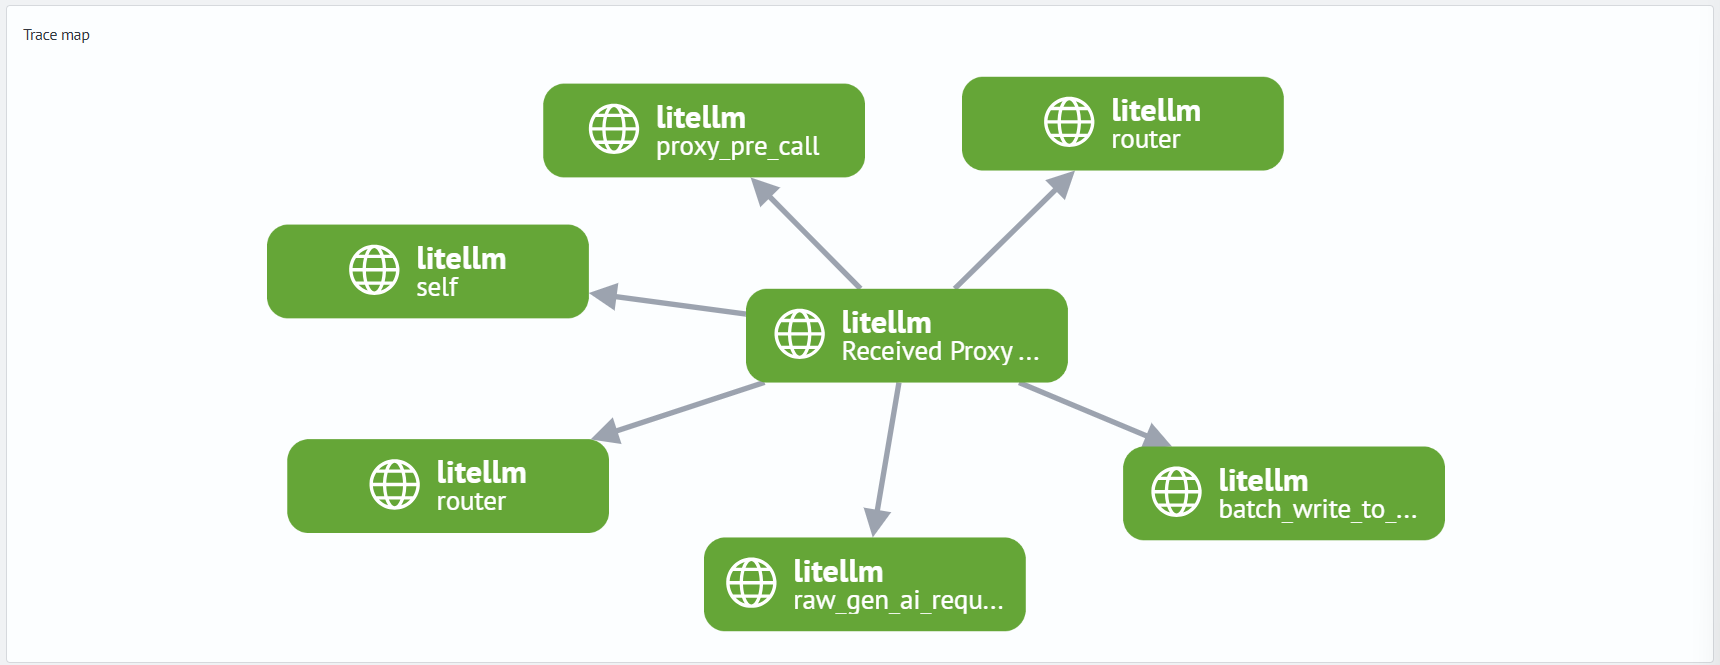
Shows the visual structure of the selected trace as a connected map of spans:
- root span of the trace
- child operations and tool calls
- connections between request execution stages
- duration of individual operations
The panel is displayed after selecting a trace in the Traces Summary table.
5. Spans and Latencies
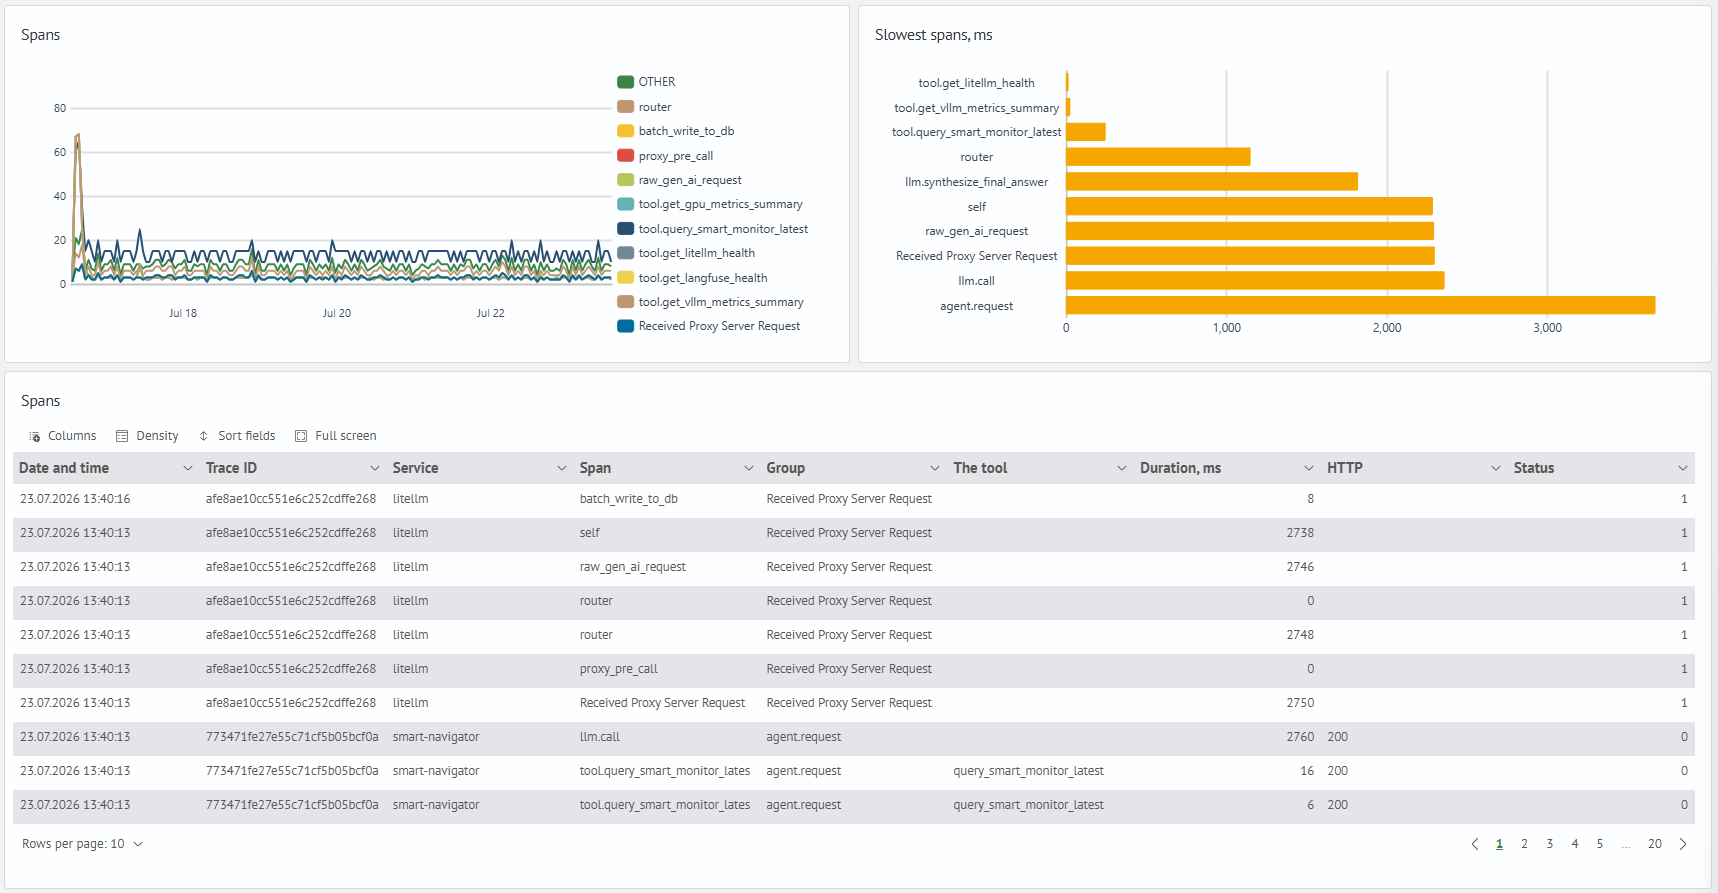
Shows span details and operation duration within traces:
- span dynamics over time
- slowest spans
- table of spans with execution parameters
- services, groups, and tools associated with span operations
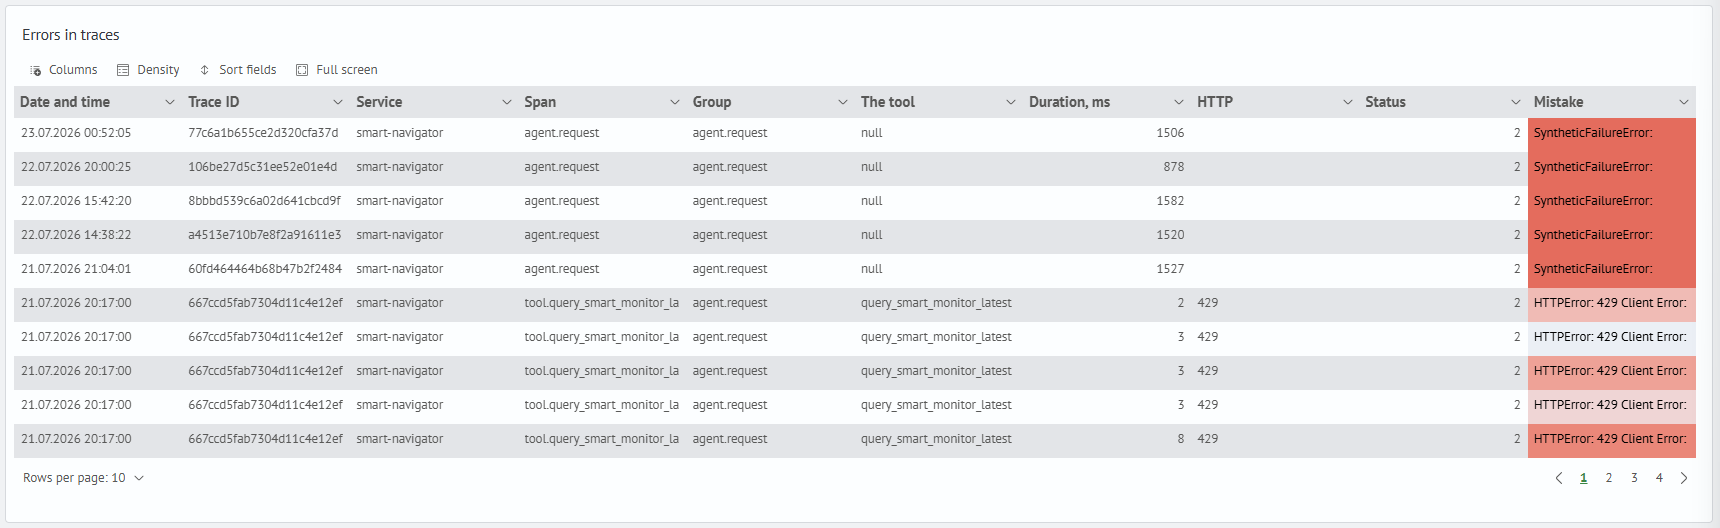
6. Trace Errors
Shows errors occurring during trace execution and individual span operations:
- list of erroneous spans
- services and operations where errors occurred
- duration of erroneous operations
- error dynamics by services over time