AI Observability: Infrastructure Overview
The AI Observability: Infrastructure Overview dashboard provides a unified operational picture of the AI environment status.
It is designed for quick verification that all components are alive, data is flowing, and there are no anomalies in activity.
Useful for: operations engineers, on-call personnel, AI team leaders.
Data sources: gen_ai_events*,gen_ai_metrics*, gen_ai_gpu_metrics*, gen_ai_cost*, gen_ai_traces*
Main Sections
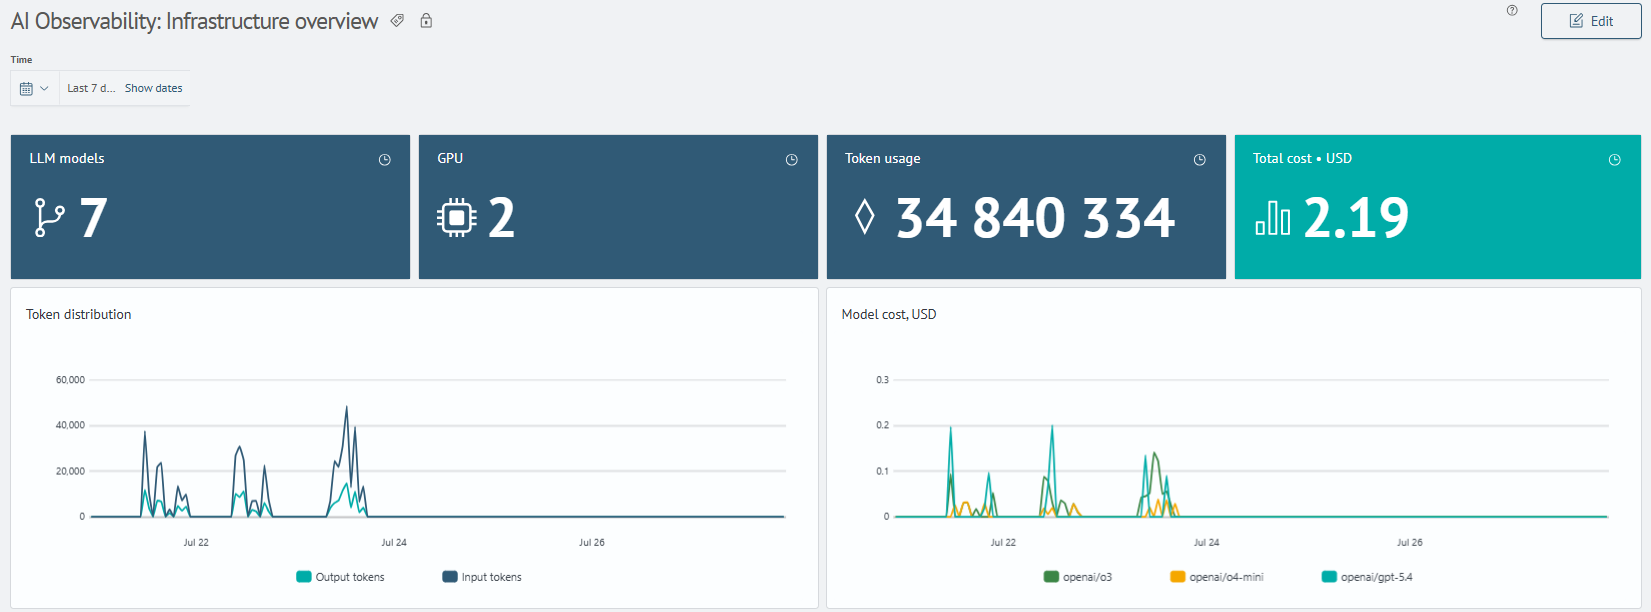
1. Key Parameters
Shows summary and graphs of key parameters:
- number of connected LLM models, their total token consumption and costs
- number of GPUs
- distribution of tokens and model costs
2. LLM Models and AI Services
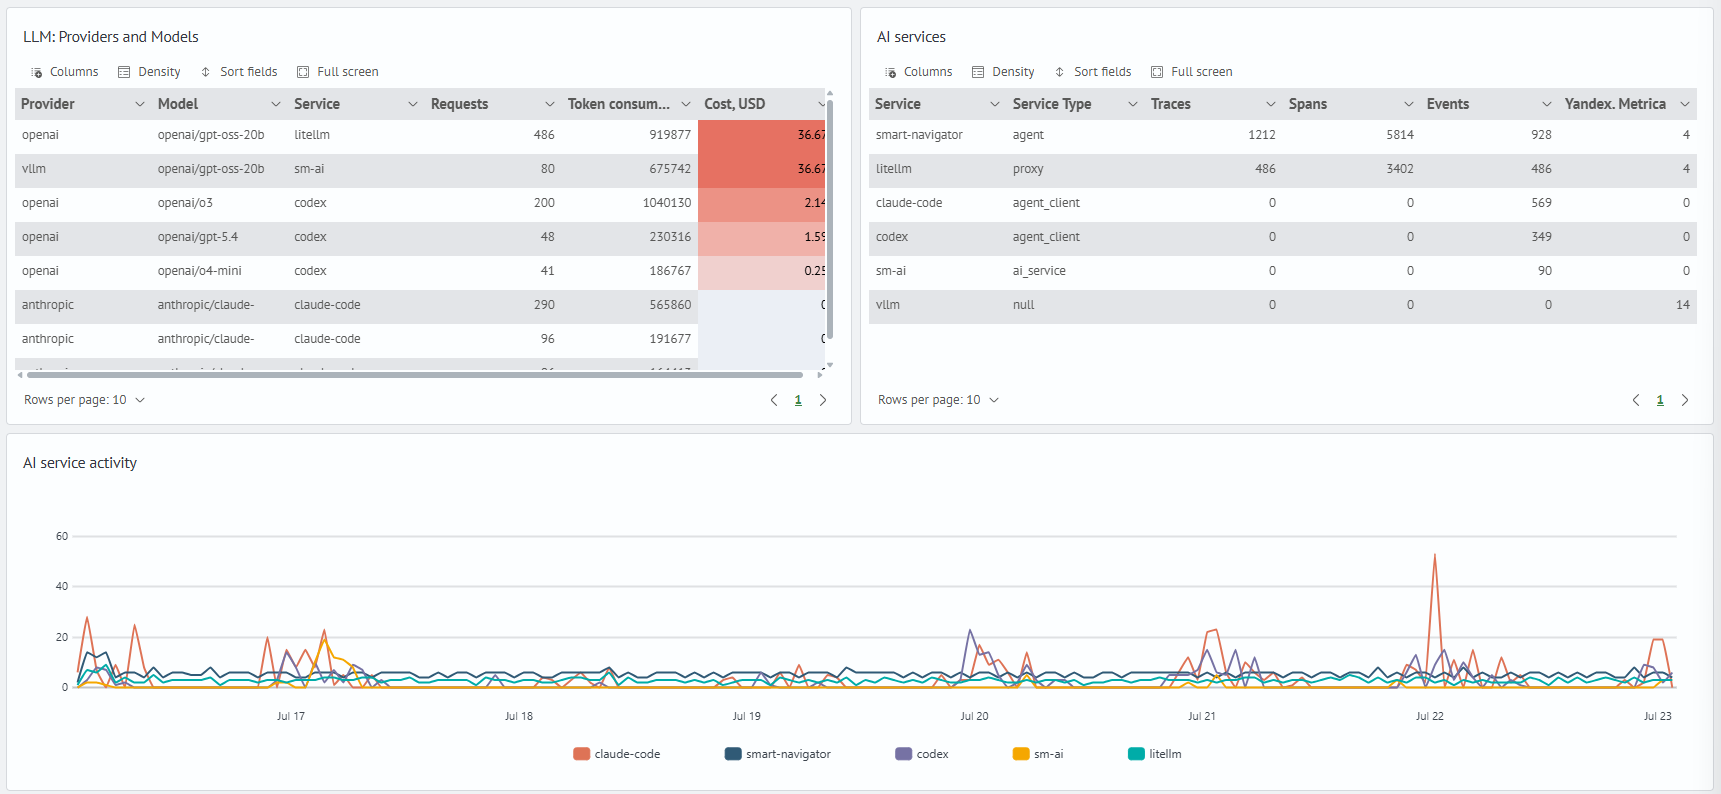
Shows information about used LLM models and AI services through which requests are executed and telemetry is received:
- number of requests, traces, and events
- consumption of input and output tokens
- average request execution duration
- cost of model usage
- graph of request and event dynamics by AI services
3. GPU and AI Service Events
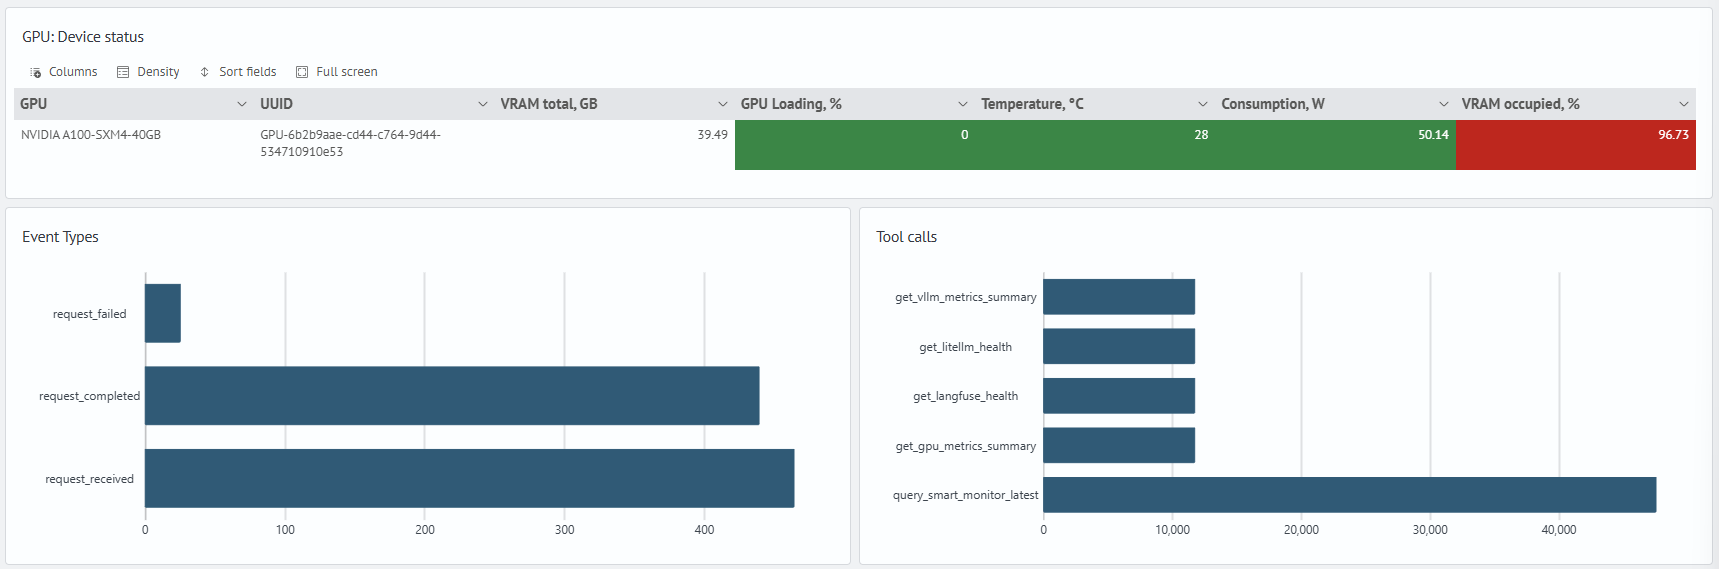
Shows GPU device status and distribution of events received from AI services:
- GPU load, temperature, and power consumption
- video memory usage
- event distribution by types
- activity of tools and internal AI service operations
4. Model Requests and Agent Results
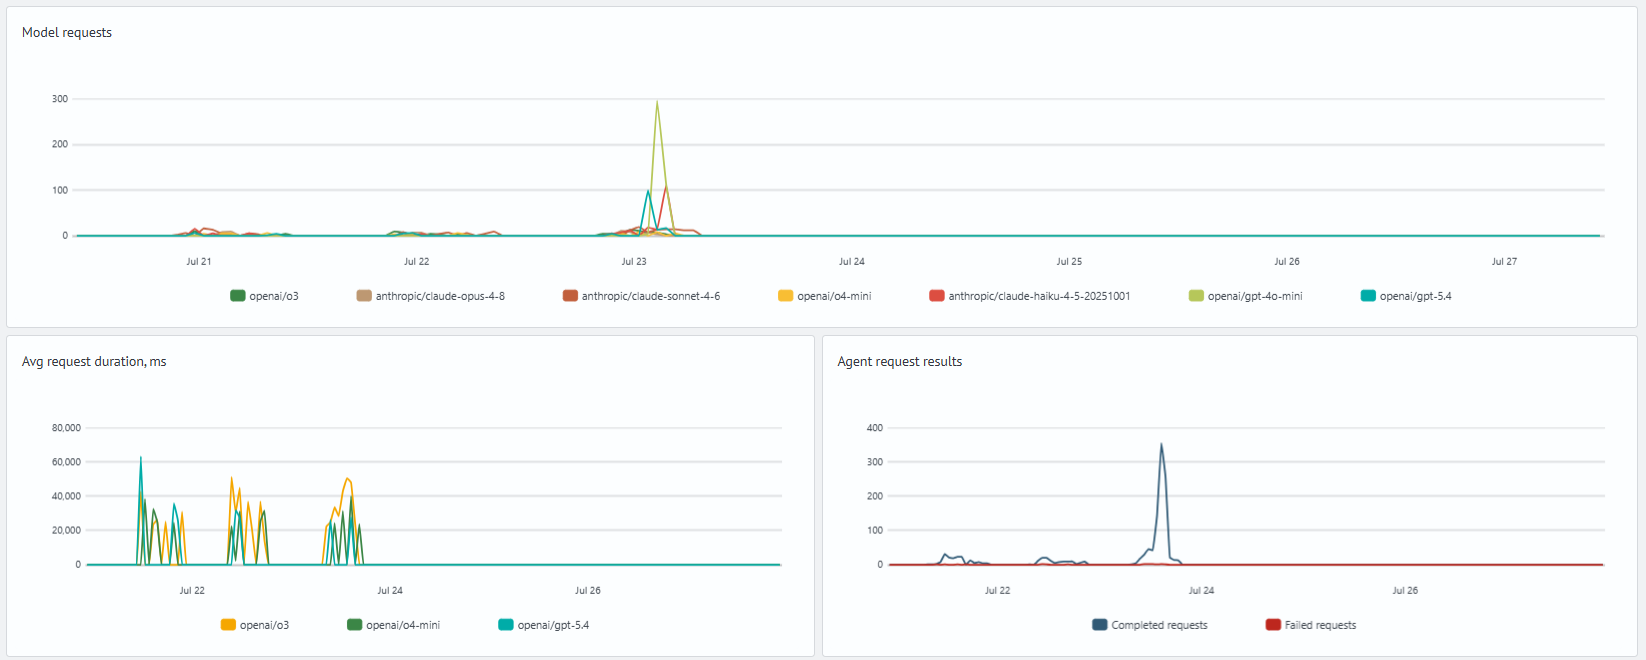
Shows dynamics of requests to LLM models and results of agent operations:
- number of model requests over time
- average request execution duration
- ratio of successful and erroneous requests
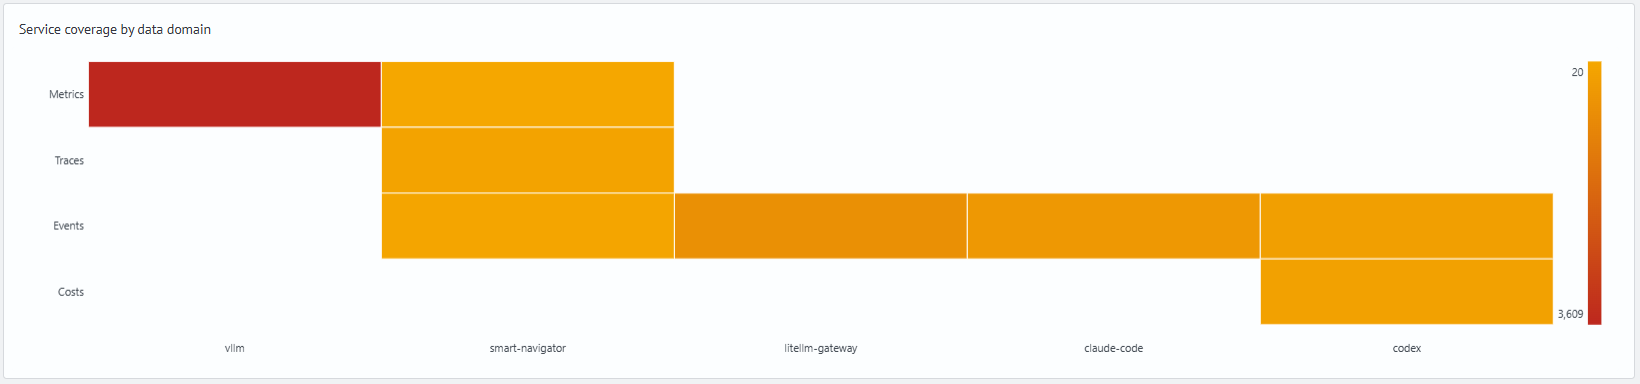
5. Service Coverage by Data Domains
Shows what types of telemetry are received from AI services:
- service coverage by metrics, traces, events, and costs
- completeness of incoming telemetry by services
Transitions to Other Dashboards
Direct transitions from the AI Observability: Infrastructure Overview dashboard are available to specialized dashboards:
| Panel | Destination |
|---|---|
| LLM: providers and models table | AI Observability: LLM Costs |
| AI Services Summary table | AI Observability: Traces |
| GPU: device status table | AI Observability: GPU Status |