AI Observability: Agents
The AI Observability: Agents dashboard is designed to monitor AI agent behavior.
It allows analyzing incoming requests, response quality, token consumption, and latency at the level of individual agent interactions.
Useful for: AI agent developers, operations engineers, analysts.
Data sources: gen_ai_events*, gen_ai_cost*, gen_ai_traces*
The dashboard is designed to analyze AI agents operating within the infrastructure. Claude Code and Codex are analyzed in separate dashboards.
Main Sections
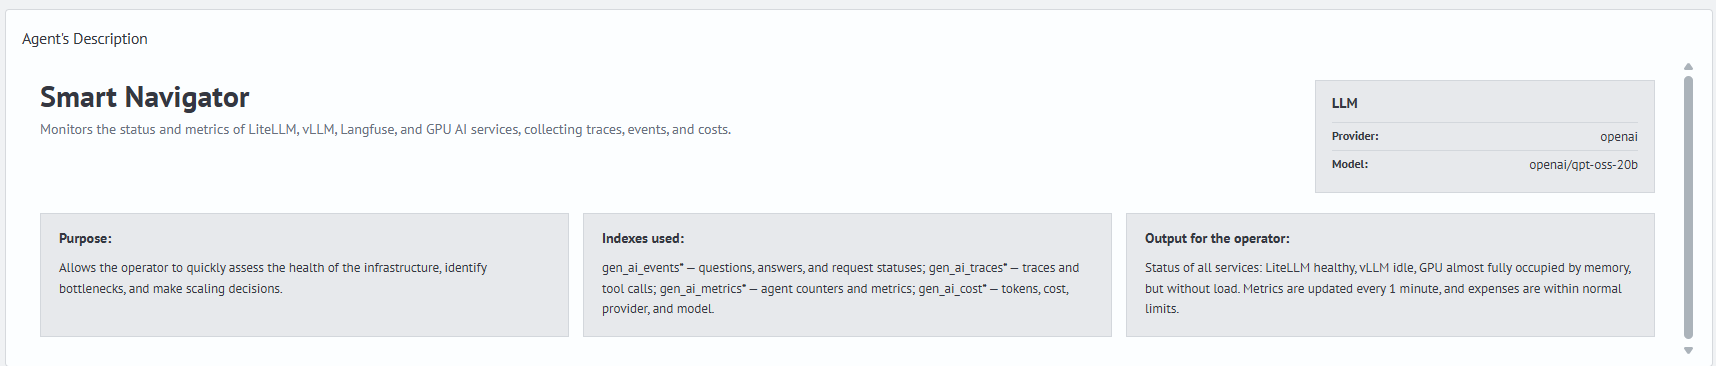
1. Agent Description
Shows general information about the selected AI agent and its current state.
The description is automatically generated using the ai command, which sends data about the selected agent to an LLM model and receives a brief context description for the operator:
- name and role of the selected AI agent
- agent's purpose
- telemetry sources used
- LLM provider and model identified from request data
- brief summary of the agent's current state
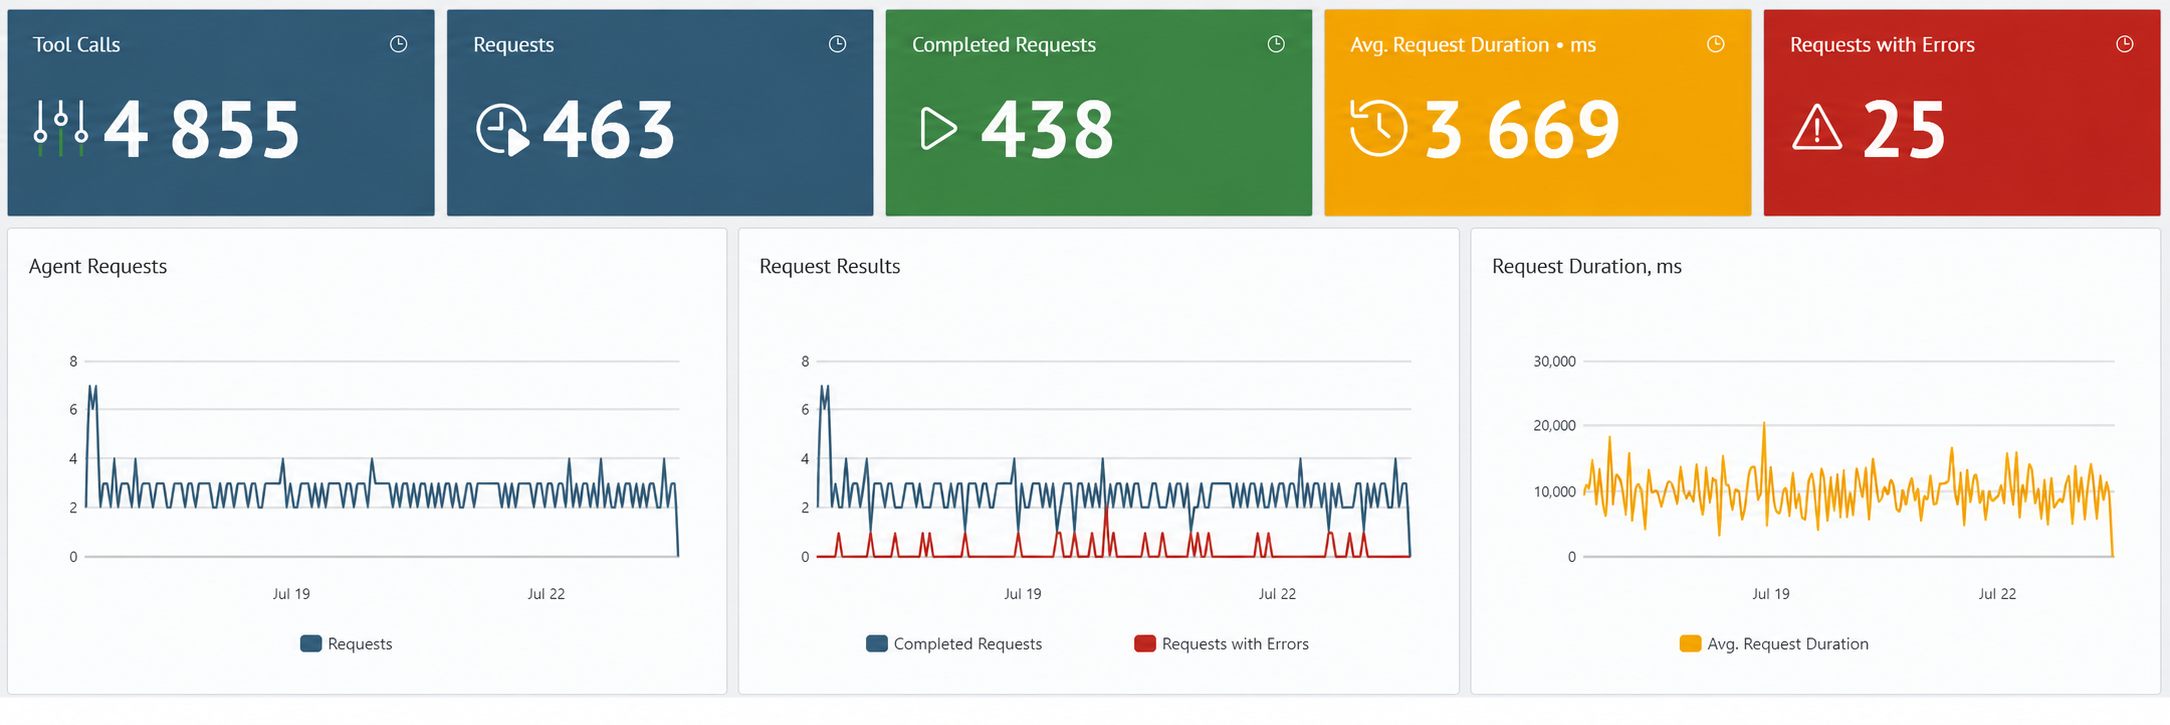
2. Request Activity and Quality
Shows summary performance indicators of the selected AI agent for the specified period:
- number of tool calls and agent requests
- number of completed requests and requests with errors
- average request execution duration
- dynamics of requests, errors, and duration over time
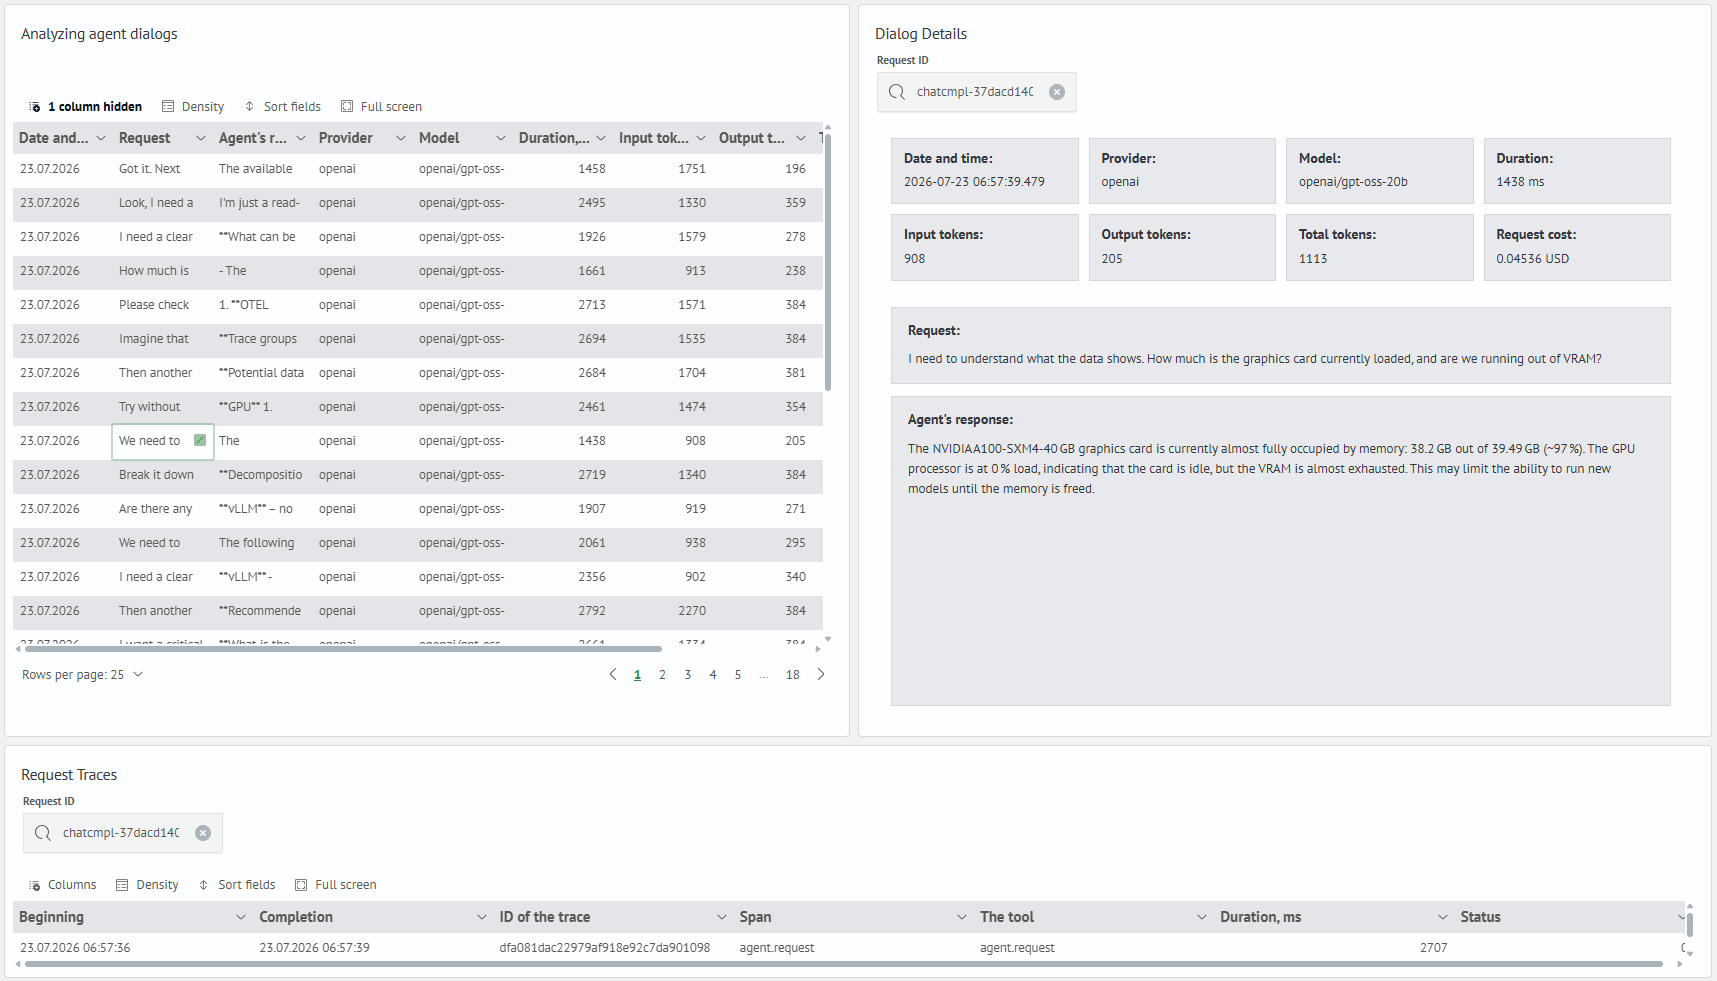
3. Agent Dialogs
Shows a table of agent interactions with requests, responses, and key execution parameters:
- request execution time
- agent's request and response text
- model and provider used
- duration, token consumption, and request cost
When selecting a table row, two drilldown panels open:
- Dialog Details — request ID, execution time, model, tokens, cost, full text of agent's request and response
- Request Traces — spans of the selected dialog: trace ID, span name, tool, duration, and status
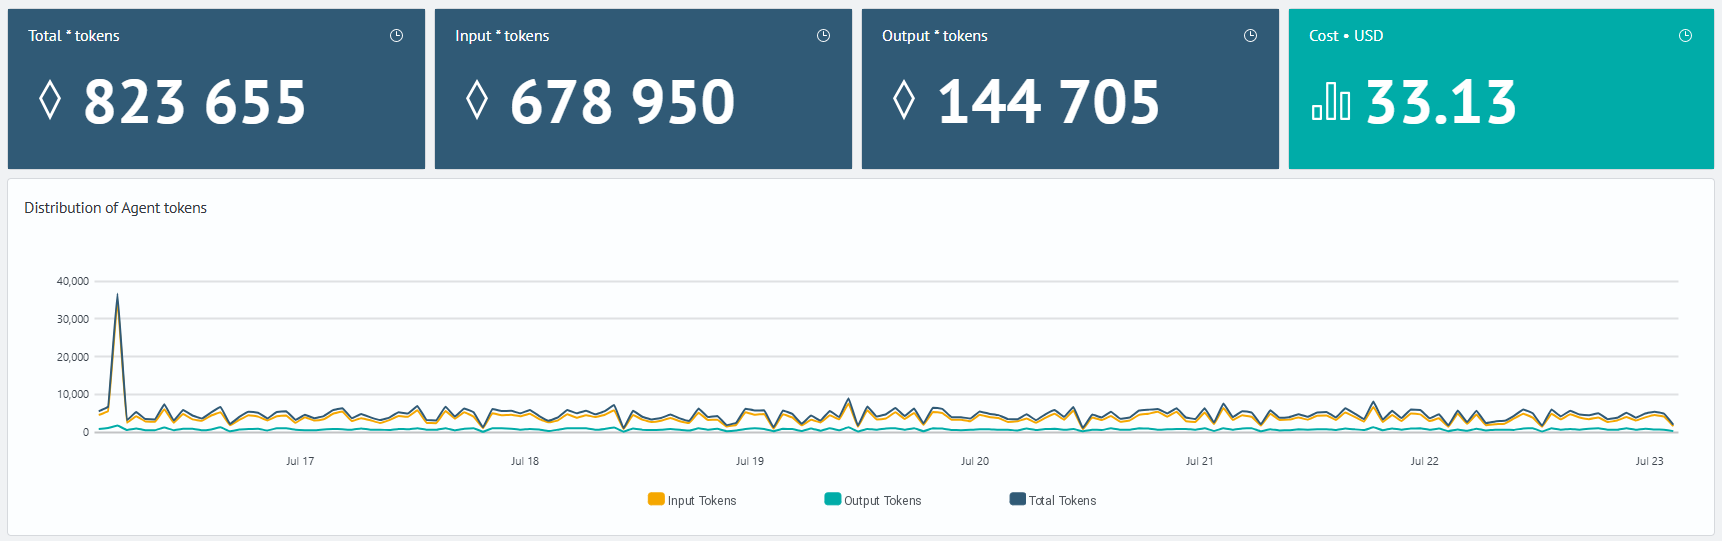
4. Token Usage and Cost
Shows token consumption and cost of requests for the selected AI agent:
- total token consumption
- input and output tokens
- cost of model usage
- distribution of agent tool calls
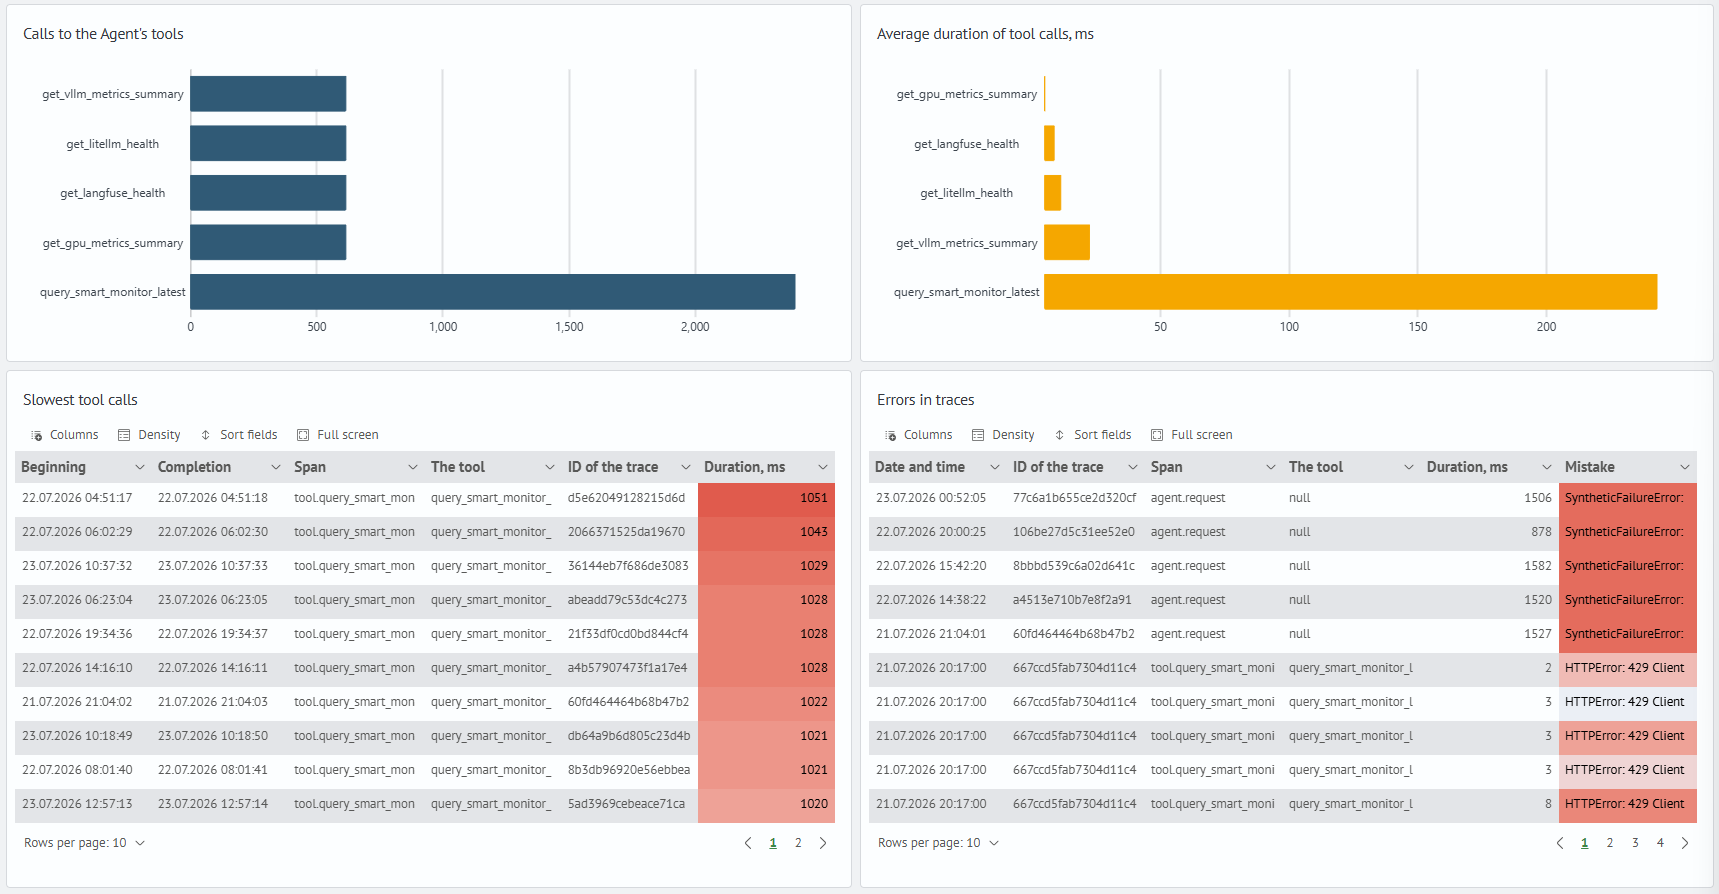
5. Latencies and Errors
Shows latencies and errors in traces:
- slowest calls
- errors in traces and related operations
Transitions to Other Dashboards
For detailed analysis of specific span operations, direct transitions from the AI Observability: Agents dashboard are available to the dashboard:
| Panel | Destination |
|---|---|
| Request Traces drilldown table | AI Observability: Traces |
| Slowest Tool Calls table | AI Observability: Traces |
| Trace Errors table | AI Observability: Traces |