AI Observability: GPU health
The AI Observability: GPU health dashboard is designed to monitor the status of graphics cards serving inference workloads.
It allows tracking GPU load, memory consumption, temperature, and hardware errors to prevent degradation and equipment failure.
Useful for: ML infrastructure engineers, system administrators, DevOps.
Data source: gen_ai_gpu_metrics*
Main Sections
1. General Parameters and GPU Status
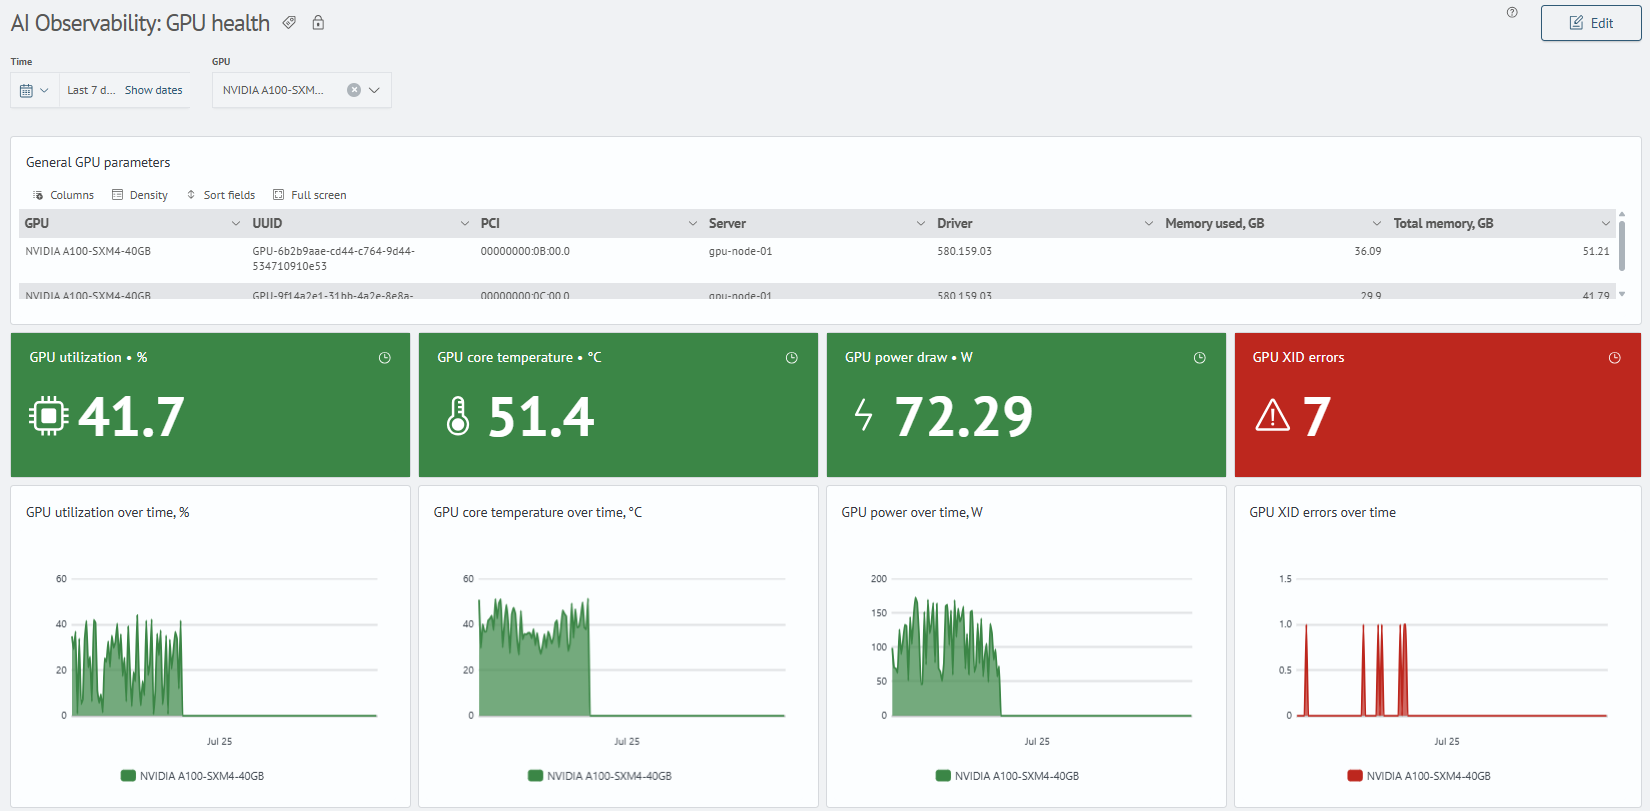
Shows information about the selected GPU and its main status indicators:
- model, UUID, PCI address, server, and driver version
- total and occupied GPU memory volume
- current GPU load
- core temperature and power consumption
- presence of XID errors
- dynamics of load, temperature, power, and errors over time
2. GPU Memory
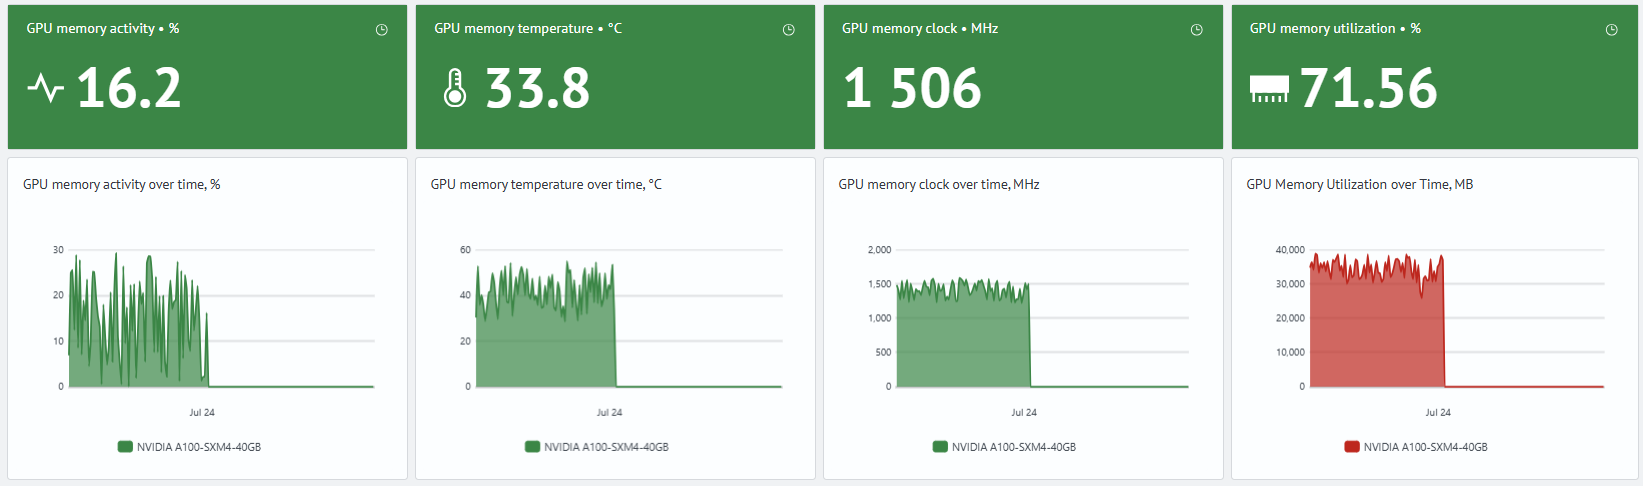
Shows the status and dynamics of GPU memory usage:
- GPU memory activity
- GPU memory temperature
- GPU memory frequency
- GPU memory utilization
- dynamics of memory indicators over time