AI Observability: Service Metrics
The AI Observability: Service Metrics dashboard is designed to monitor AI service performance at the runtime metrics level.
It allows tracking inference service load, request queue status, latency, and cache to promptly identify performance degradation.
Useful for: ML infrastructure engineers, operations engineers, DevOps.
Data source: gen_ai_metrics*
Main Sections
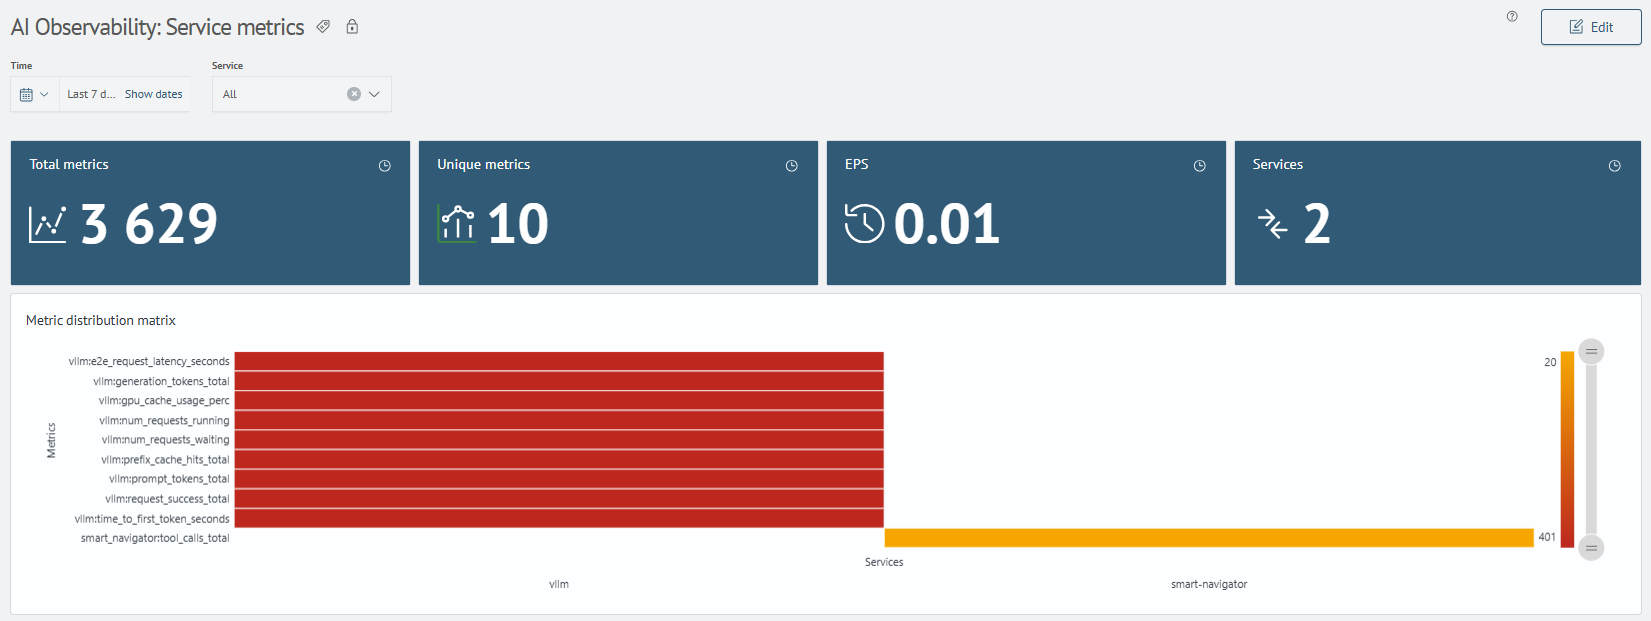
1. Metrics Summary and Distribution
Shows the overall picture of runtime metrics received from AI services:
- number of services and unique metrics
- total number of received metrics and EPS
- distribution of metrics by services
- metrics coverage matrix for services
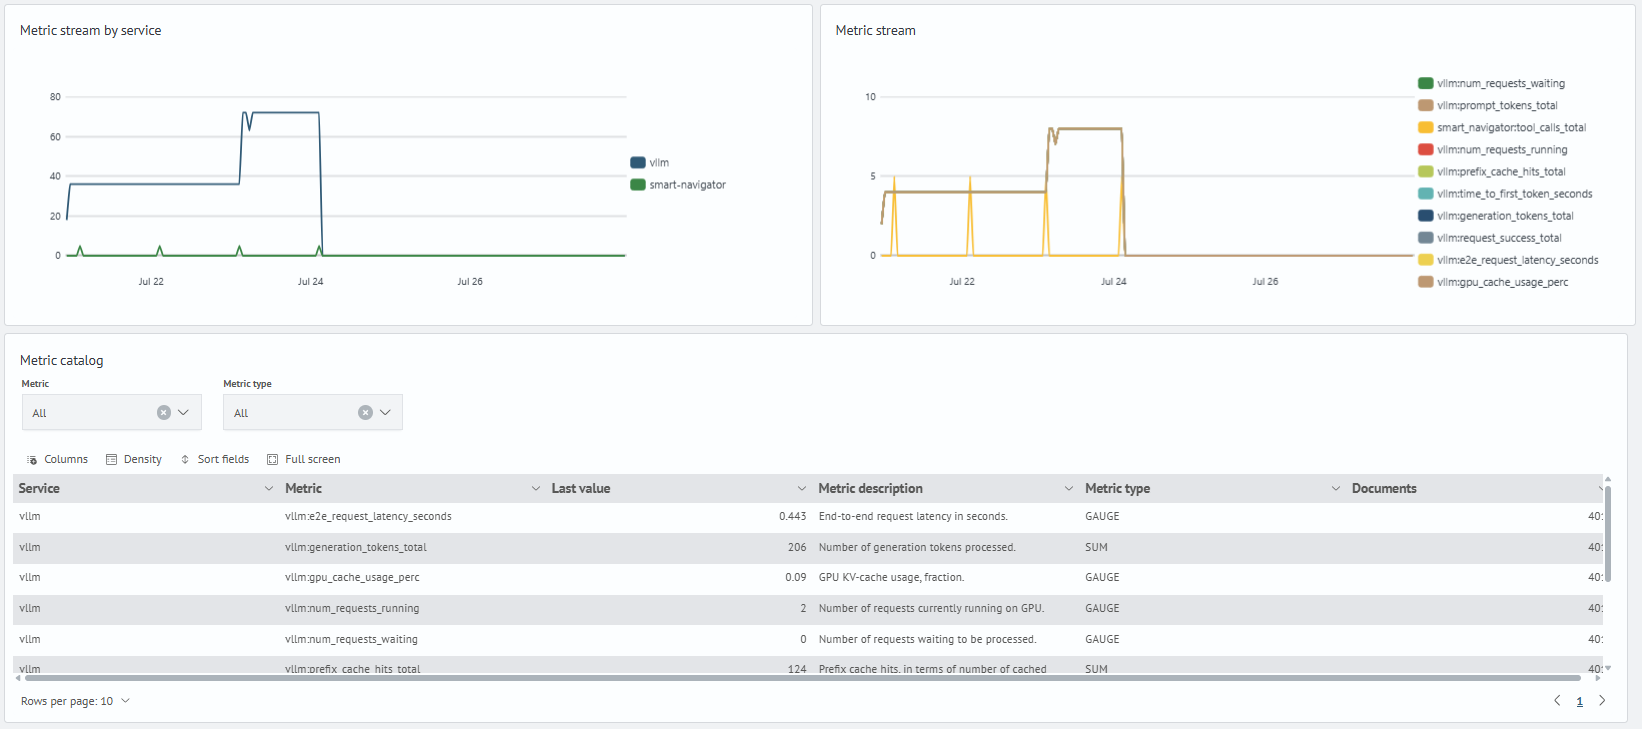
2. Metrics Stream, Catalog, and Values
Shows metrics flow dynamics, their catalog, and values of the selected metric:
- metrics flow by services over time
- dynamics of individual metrics
- catalog of available metrics with type and last value
- drilldown from catalog to values of selected metric
- graph of selected metric values over period
When selecting a metric in the catalog, a detailed panel opens with values of the selected metric for the specified period.