Adaptive Metric Models
Description
An adaptive metric model calculates threshold parameters based on the metric’s historical data. This approach eliminates the need to configure criticality ranges manually and instead derives them from the metric’s actual behavior.
Each adaptive model corresponds to a single metric.
Purpose
Adaptive models allow you to:
- automatically calculate criticality ranges for metrics
- apply different calculation rules and time windows
- train the model separately for metric objects when the metric is split by dimensions
Algorithms
The following model types are available for adaptive metrics:
| Model Type | Name in the Interface | Description | Calculated Parameters |
|---|---|---|---|
std_dev | Standard Deviation | Calculates the mean and standard deviation based on historical data. | mean, std |
quantile | Percentile | Calculates percentile values based on historical data. | percentile values from 0 to 100 |
range | Range | Calculates the historical minimum and maximum. | min, max |
percentage | Percentage Deviation | Calculates the mean value from which a percentage deviation is then defined. | mean |
Model Training
The model is trained according to the specified automatic retraining frequency, using metric values from the selected training period and the configured algorithm, filter groups, and time windows.
If rule overrides are configured for the metric, the model is calculated separately for each filter set. For rules with time windows, parameters are calculated within the corresponding windows. The default rule uses data that does not fall within those windows.
When calculating the health of an adaptive metric, the system uses the most recent completed training result. If no result is available for the current training run, or if the training run fails but parameters were calculated previously, the system continues using the previous parameters until the next successful training run is completed.
If the metric is split into objects and the Train the Model Individually by Dimensions setting is enabled, the system also calculates individual parameters for each metric object.
Individual results allow you to view parameters calculated for a specific object, such as a server, city, or another dimension value.
Note: The number of objects available for individual training is limited to
1000. If the number of objects exceeds this limit, the interface displays a warning and indicates how many objects are above the configured limit.
Training Statuses
The training history displays the model’s most recent runs and their statuses.
| Status | Description |
|---|---|
In Progress | Training has started and is not yet complete. |
Successful | Training completed successfully. |
Limit Reached | Training completed, but some objects were excluded from the individual results because the configured limit was exceeded. |
Error | Training failed. |
Model List
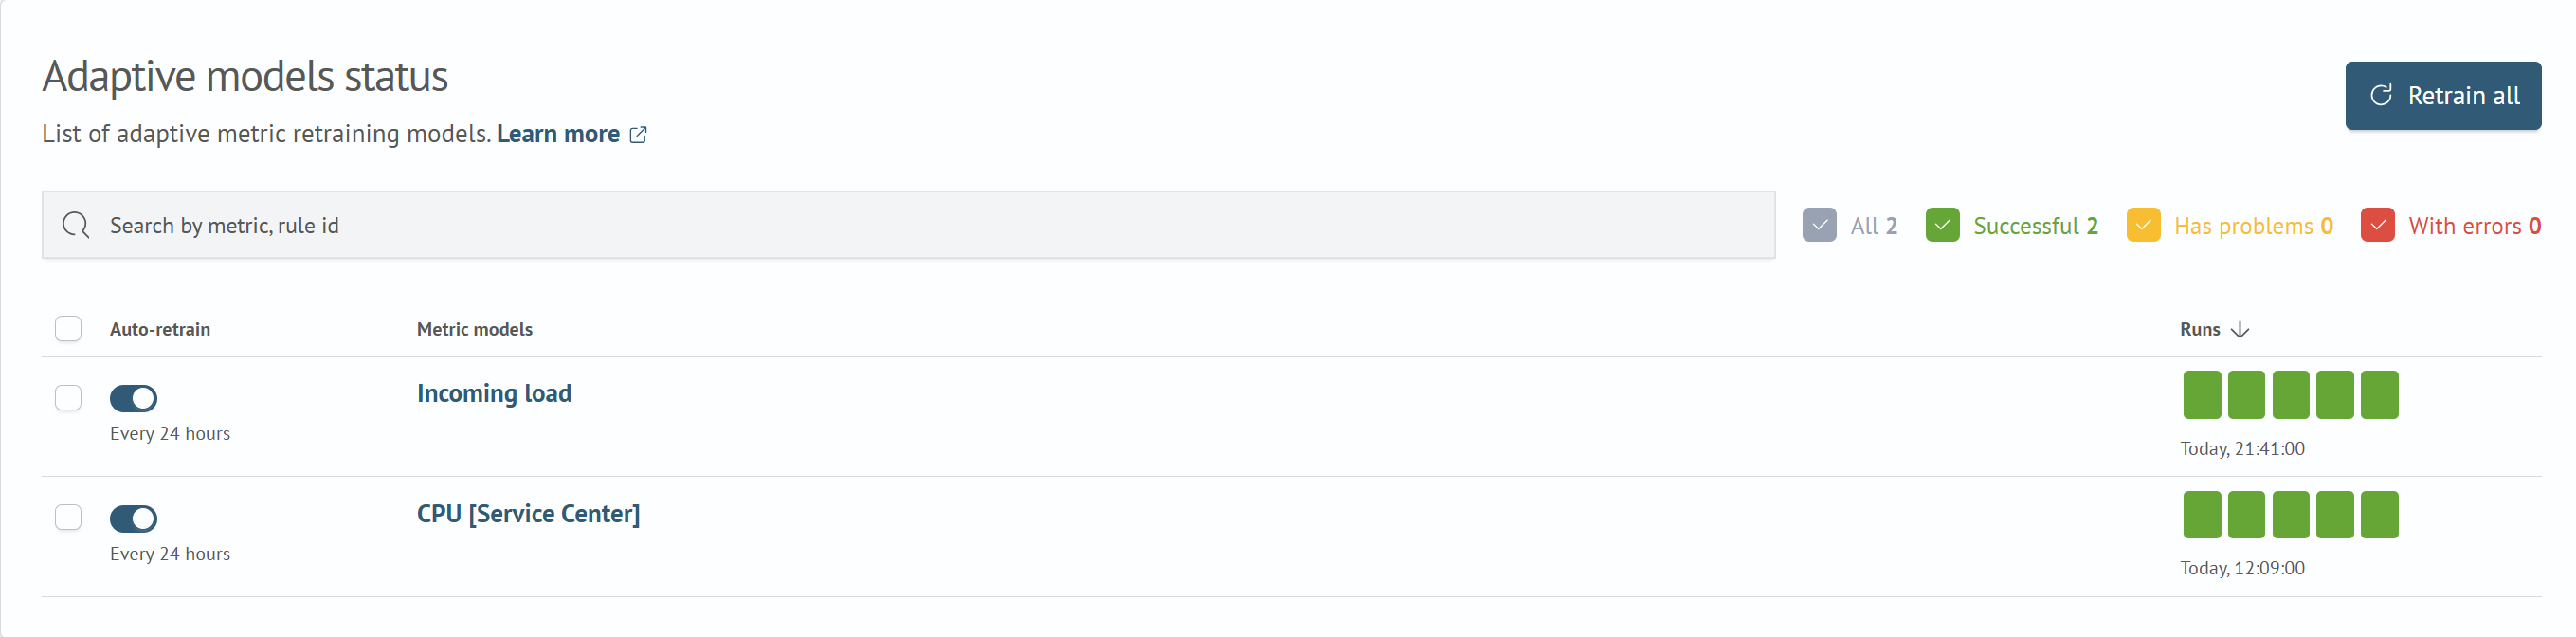
The adaptive model list is used to monitor the status of all trained adaptive metrics.
Model Card
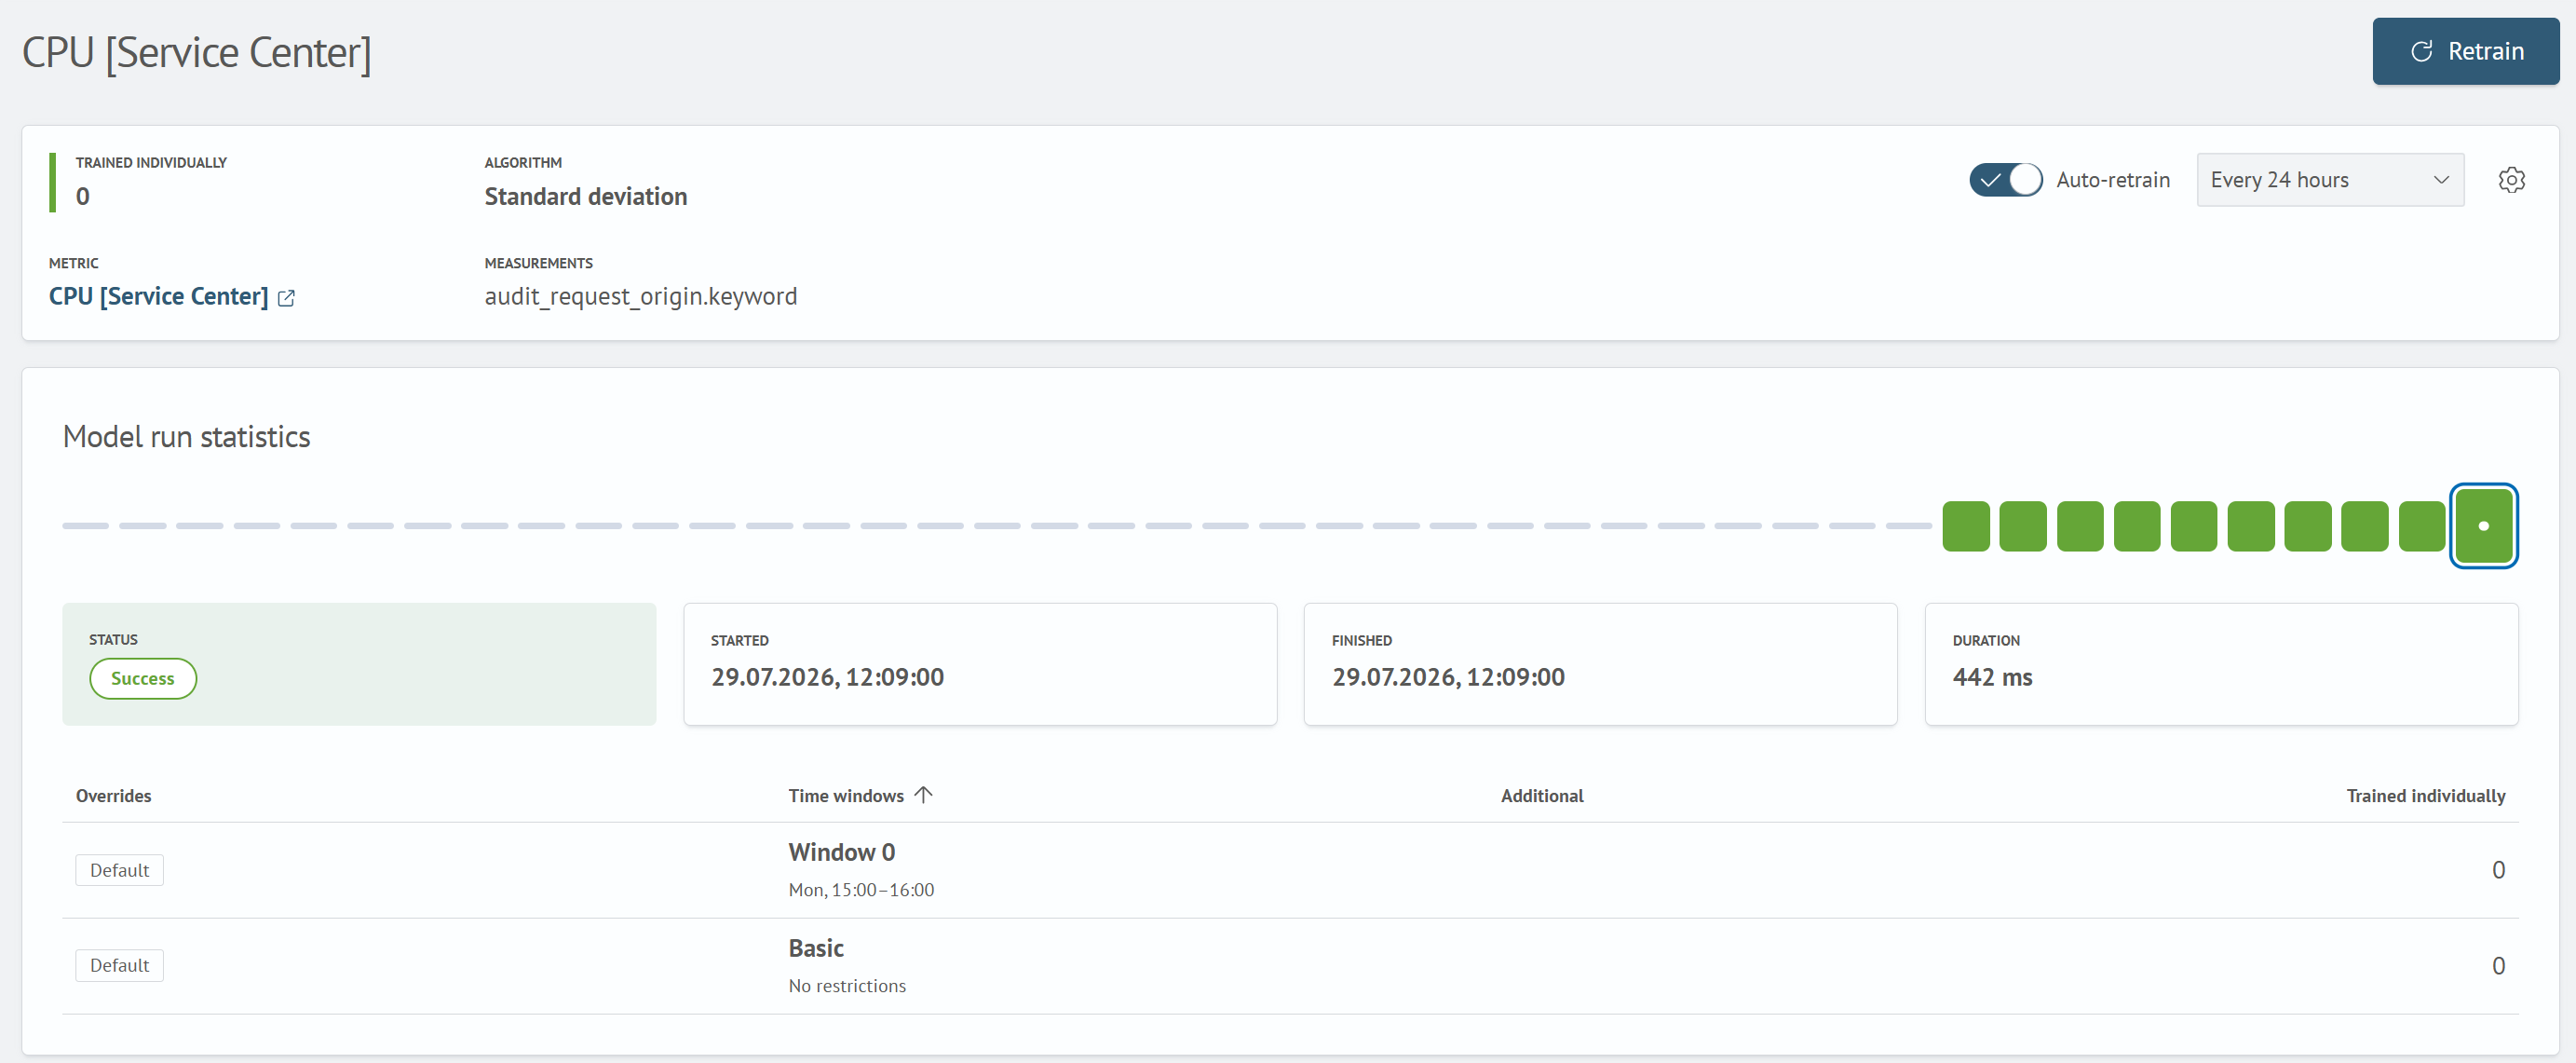
The adaptive model card contains detailed information about the selected metric.
Viewing Training Results
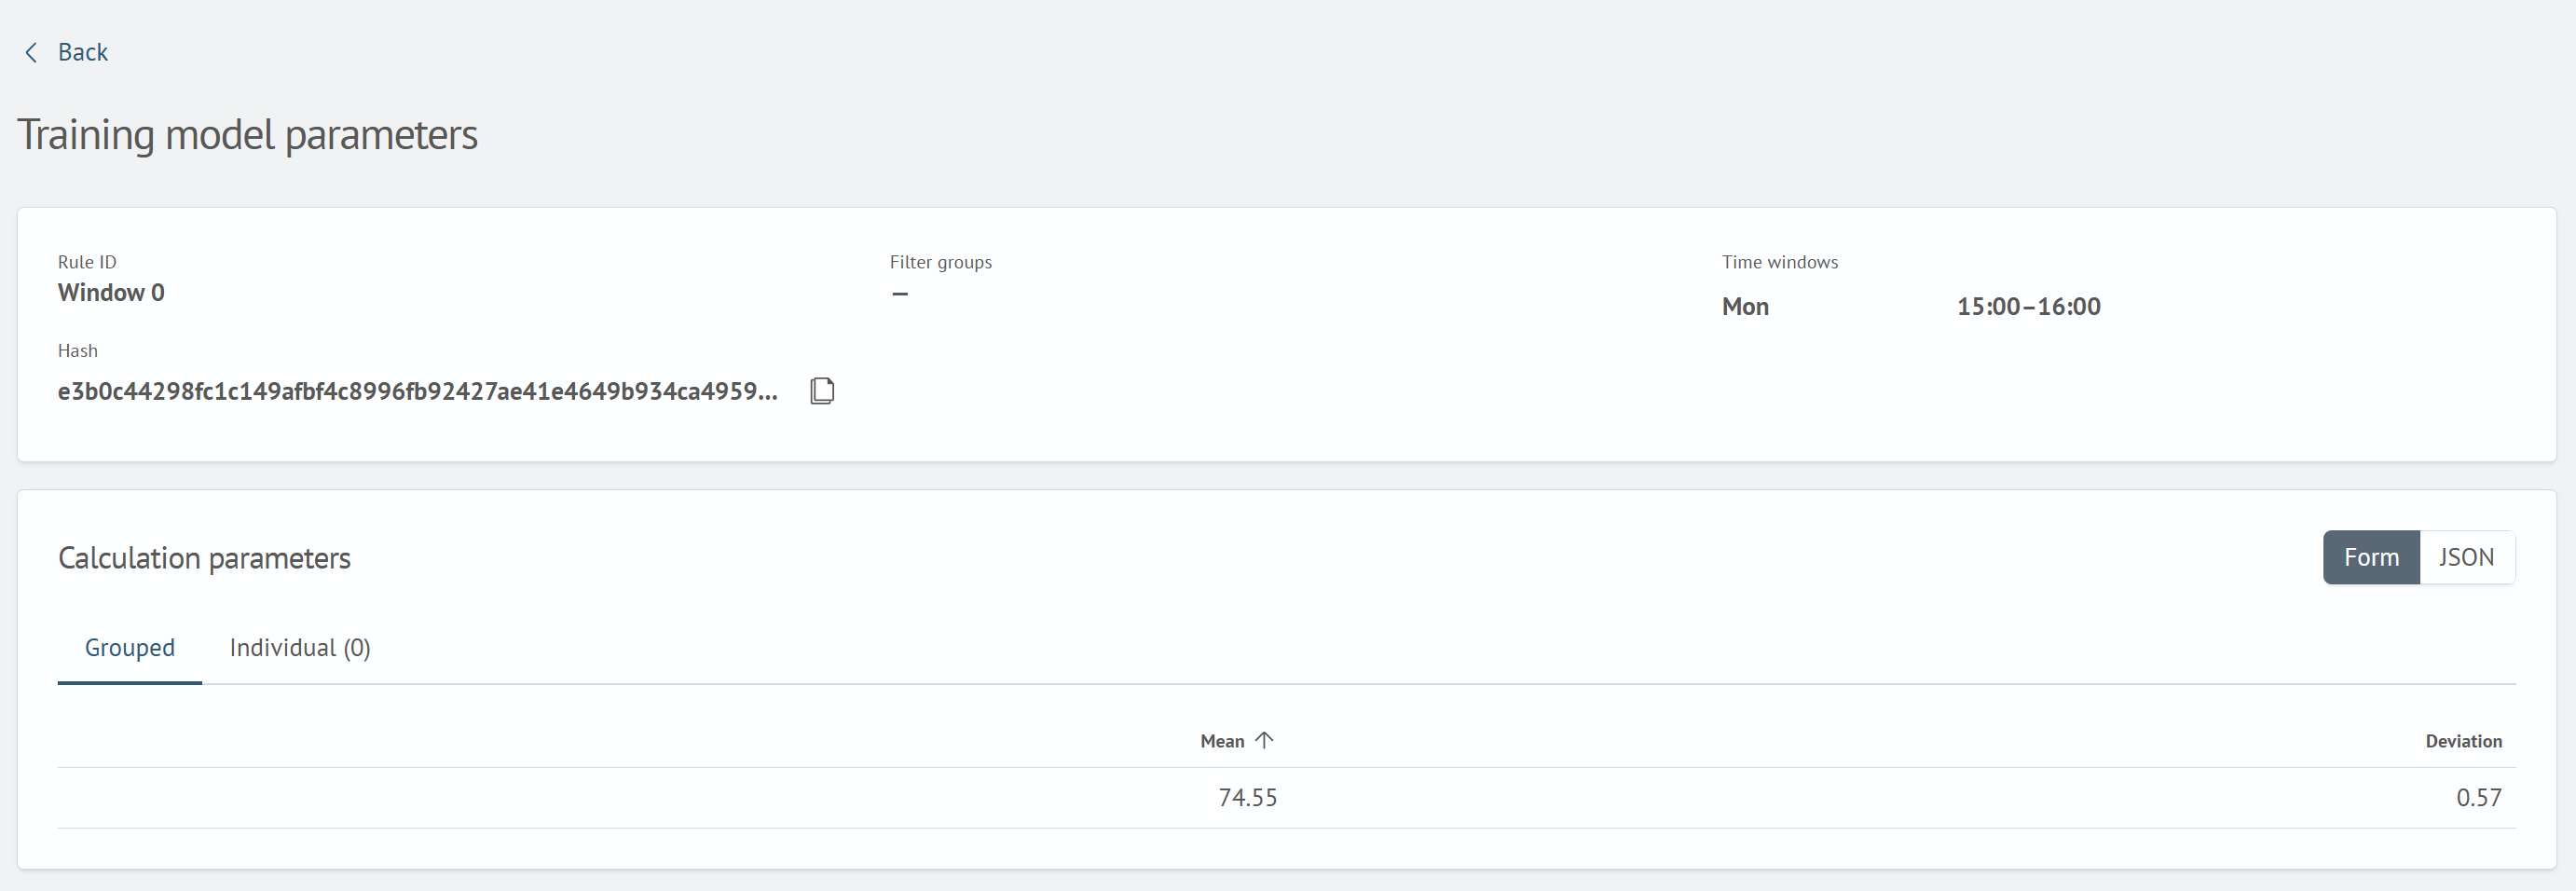
The calculated model can be opened for each training run.
Each result group contains the rule, filters, time windows, calculated parameters, number of trained objects, and number of objects exceeding the configured limit.