Deep Dive
Description
Deep Dive is a Service Monitor Toolkit analytical tool that helps identify and resolve IT environment issues. It allows tracking infrastructure state change dynamics, detailed analysis of these changes, and visual identification of parameter interdependencies within a specific health model.
The Deep Dive page contains a health swimlane table where dynamic infrastructure state changes can be viewed, an Add Data Sources panel, as well as a standard time filter.
Health Swimlane Table
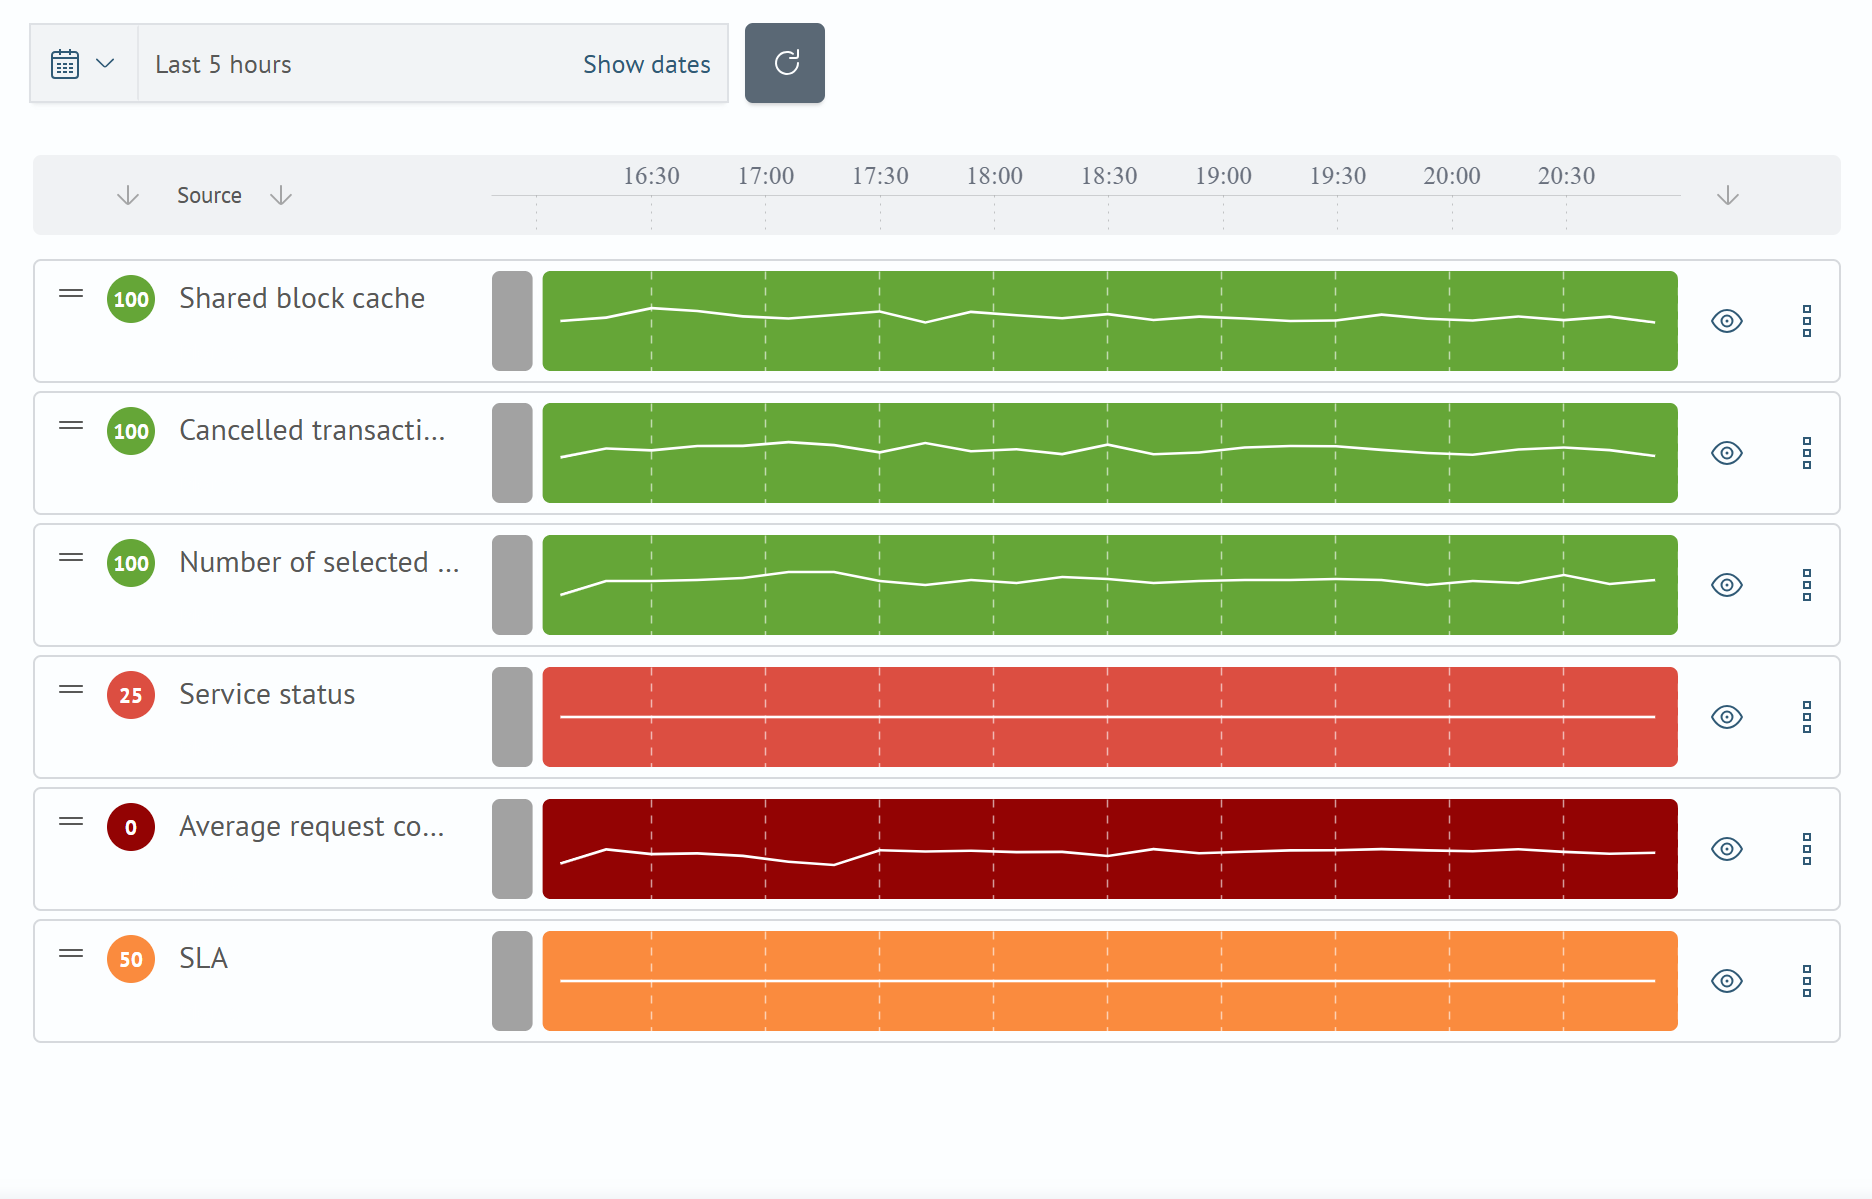
The Health Swimlane Table visualizes the history of service and metric states. Each element in the table includes:
typeof analyzed object (metric or service)- current object
state timelineof state changes over the selected period- health swimlane visibility control (hide/expand)
Additional Actionsbutton (delete and edit swimlane)
Health level on the timeline is demonstrated by corresponding colors, while change dynamics are displayed as a line graph overlaying the main swimlane.
When hovering the mouse pointer over any part of a swimlane, a tooltip appears showing the health value at that time. Health swimlanes can be moved up/down, and when hidden, a swimlane moves to the bottom of the table.
In swimlane settings, you can specify Name, Description, enable swimlane display, and select a health value aggregation function (Default is MAX).
Aggregation value types:
| Value | Description |
|---|---|
MAX | Maximum value |
MIN | Minimum value |
AVG | Average value |
SUM | Sum of values |
COUNT | Number of data points |
Adding Data Sources
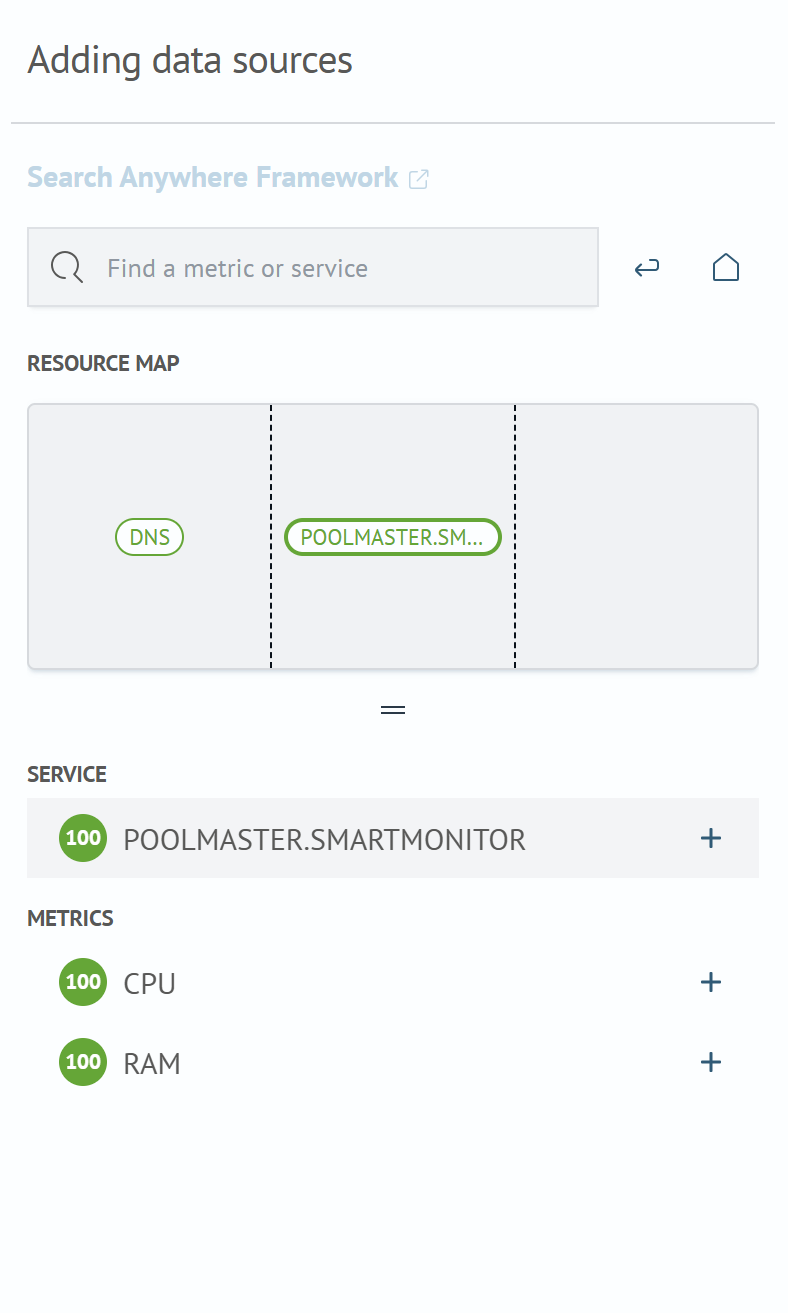
Adding data sources is a section required for searching and adding services and metrics from the model to the health swimlane table. The section consists of Resource Map and Search.
Resource Map is a navigation menu that allows moving through services across health model graph levels. When clicking on a service in the Resource Map, the selected service will be displayed below in the Service subsection, and all its internal metrics will be shown in the Metrics subsection. To add a service or metric to the table, click the + button.
To quickly navigate the resource map or add services and metrics to the table, you can use Search.
Two buttons are located next to the search field: Back and Show All Services.
Deep Dive Table
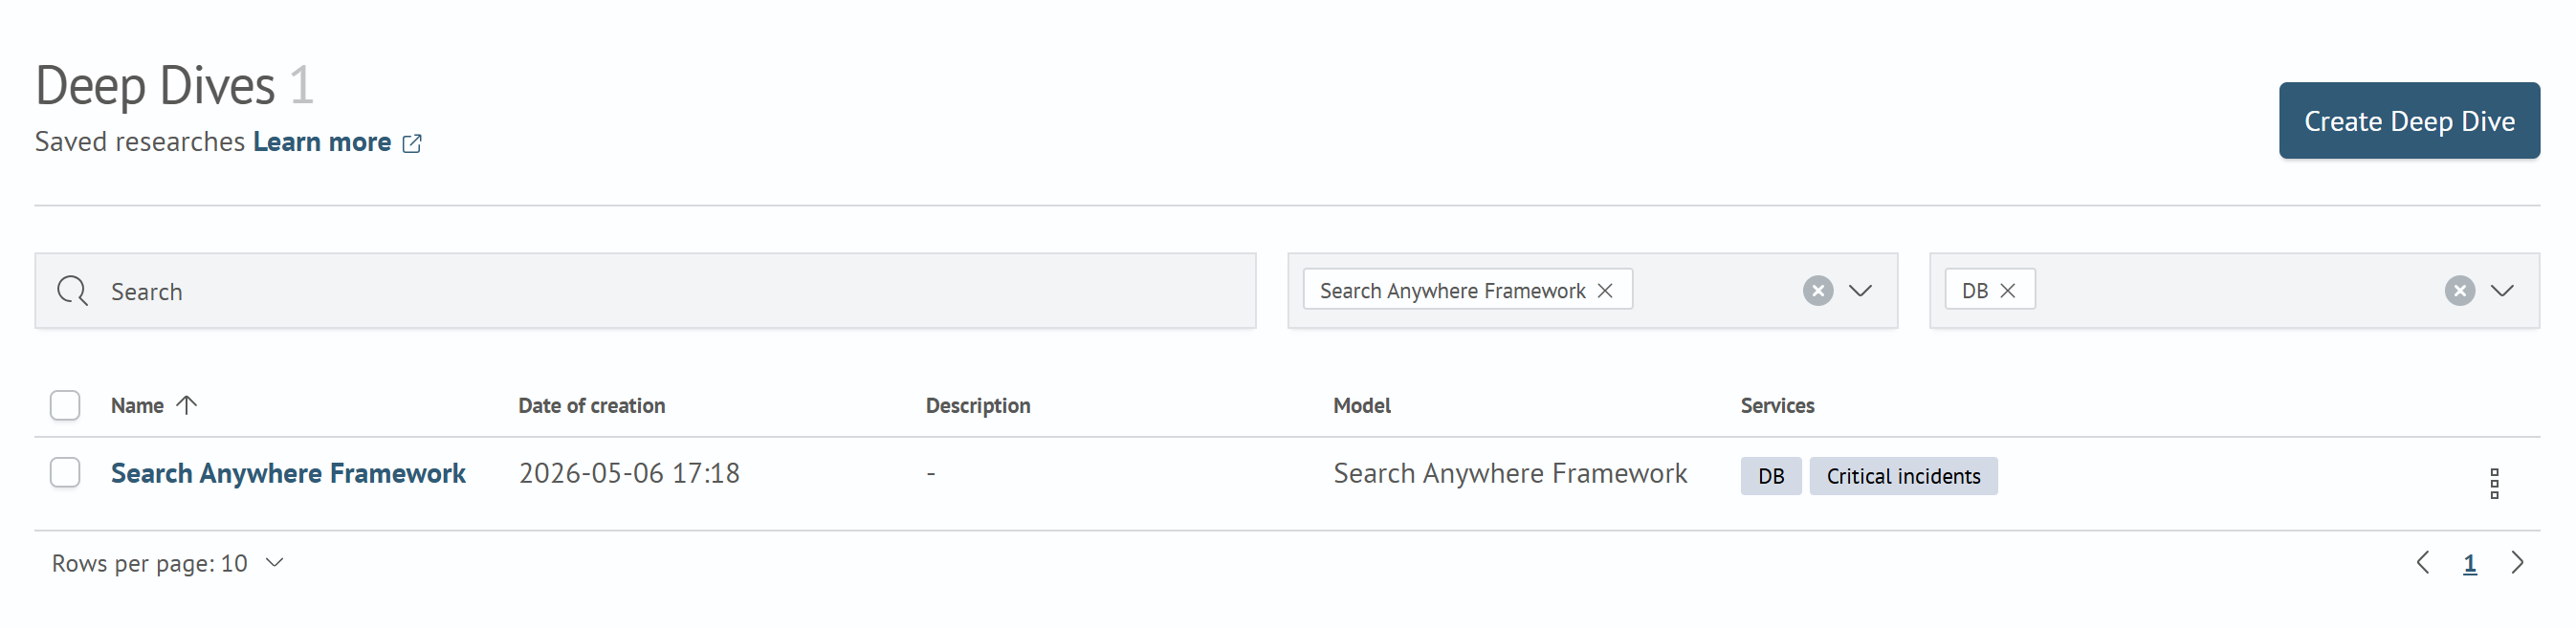
The Deep Dive Table represents a collection of available user deep dives.
Columns in the deep dive table:
| Name | Description |
|---|---|
| Name | Deep dive name |
| Date of creation | Date and time of deep dive creation |
| Description | Text description of the deep dive |
| Model | Associated health model |
| Services | All services present in the table: both fully added ones and those from which individual metrics were selected |
To create a new deep dive in the Deep Dive Table section, click the Create Deep Dive button. To delete deep dives, users need to select several deep dives and then click the Delete button. For convenient deep dive searching, filters by models and services have been added, as well as a search bar.