Use stats with eval expressions and functions
Below are commands designed to work in conjunction with statistical functions that allow you to calculate sums, averages, ranges, etc. The stats, streamstats, and eventstats commands allow you to calculate summary statistics on search results or events retrieved from the index.
timechart
Uses statistical functions (avg, count, dc, max, sum) and returns the search result as a time series chart where your data is plotted on the -axis, which is always a time field.
The timechart command allows you to perform statistical functions by distributing results over time (building a time chart). This table can then be visualized as a chart where your data is plotted on the X-axis, which is always the time field. The Y-axis can be any other field value, number of values, or statistical calculation of the field value. Time chart visualizations are typically line, area, or bar charts.
By default, the information collection period is 30 minutes. The span parameter is responsible for this.
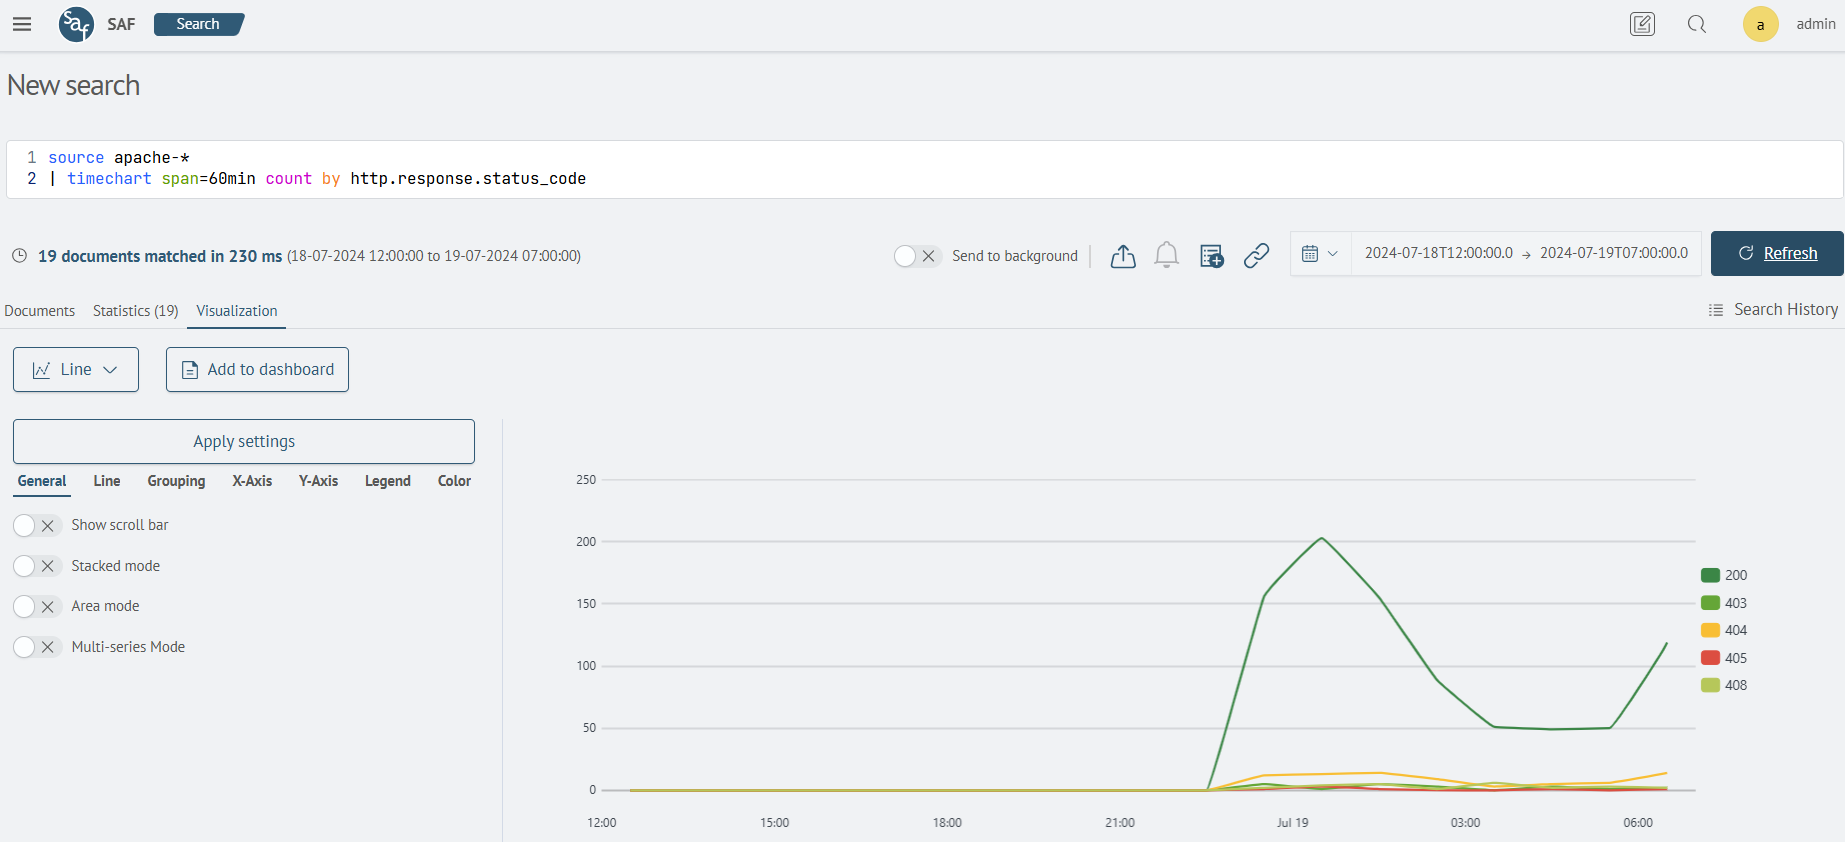
This example will display a graph of events from logs with a collection period of 60 min and sort by server response codes (the by keyword is used for this). Time range today.
source apache-*
| timechart span=60min count by http.response.status_code

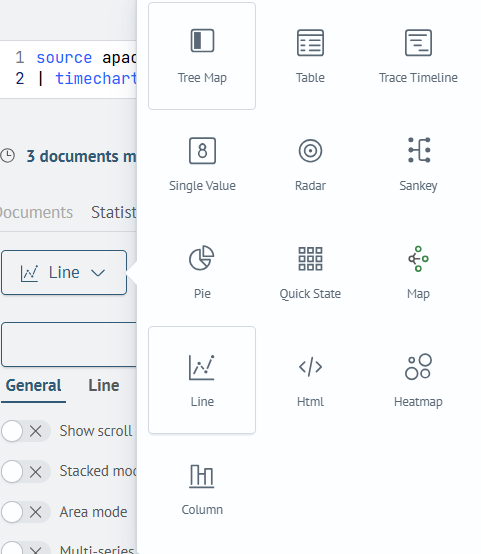
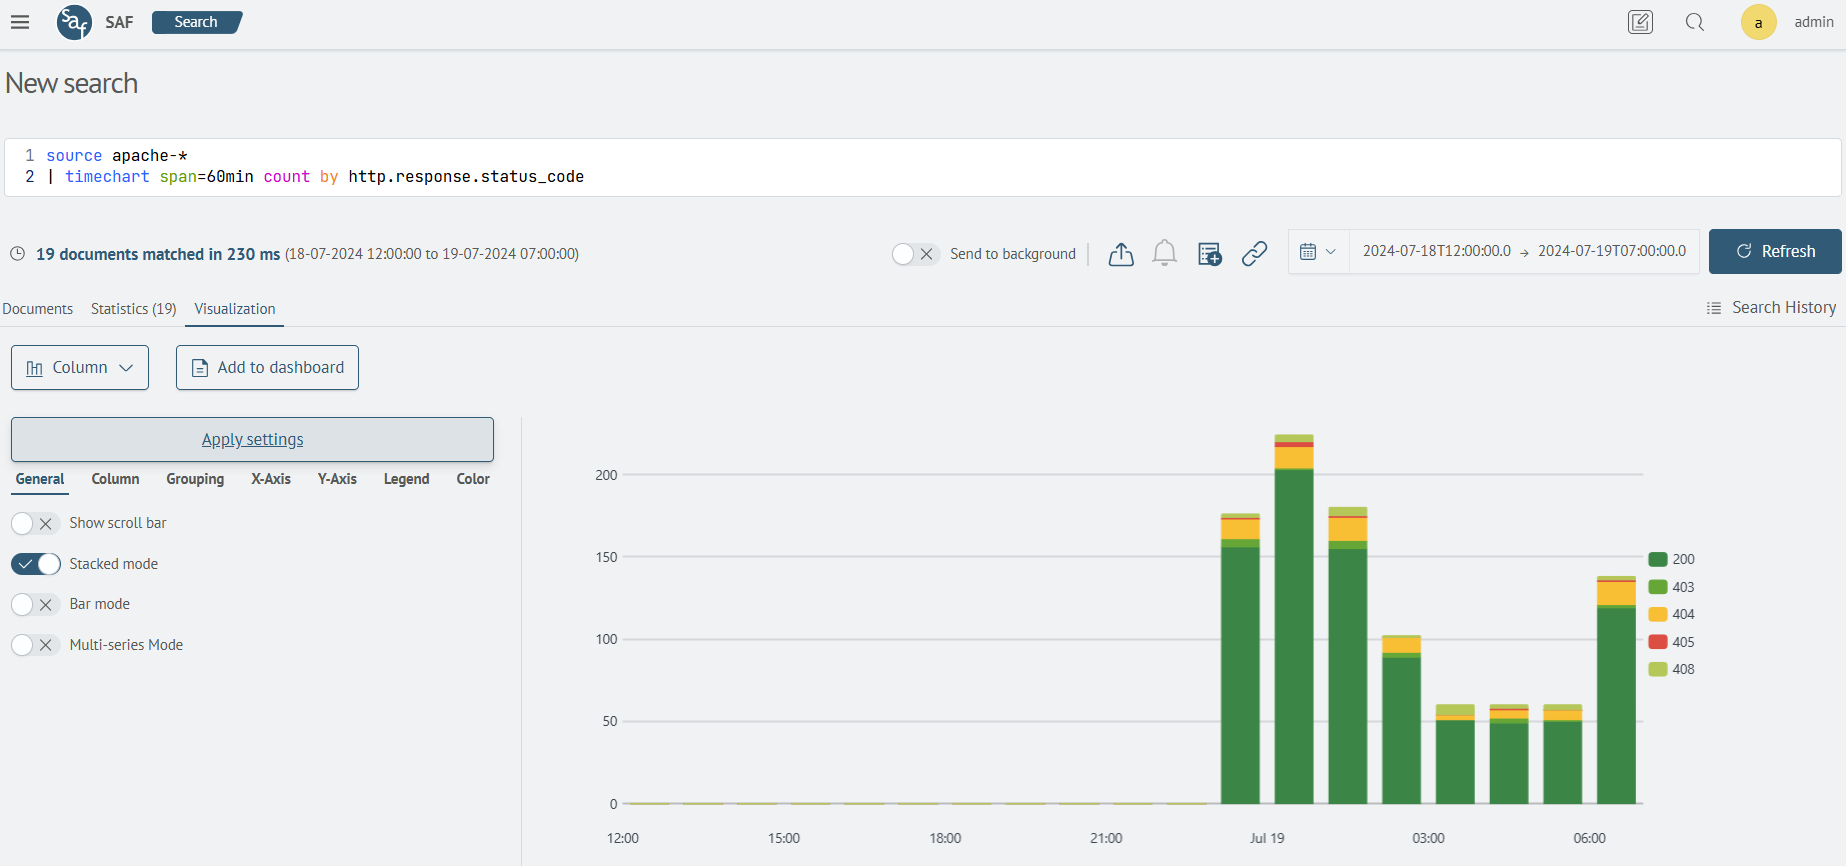
To change a line graph to a column graph, you need to select the corresponding icon on the virtualization tab.

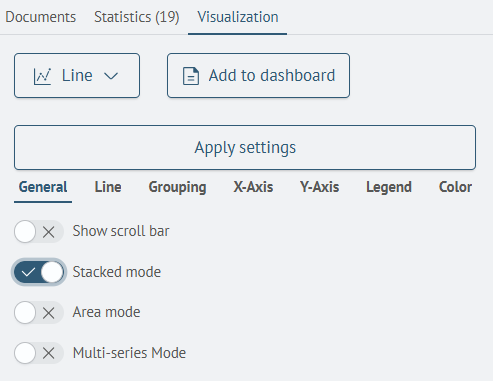
It is recommended to enable the Stacked mode option


chart
Unlike the timechart command, which uses the time field for the X-axis, the chart command allows you to use an arbitrary field as the X-axis. This uses the over keyword to determine which field occupies the X-axis. Supports chart visualization: column, line, area, and pie chart.
The example will display information on the maximum order value, sorted by user IDs.
source food_orders
| chart max(total_price) by user_id

The example will display information on the minimum order value, sorted by user IDs.
source food_orders
| chart min(total_price) by user_id
The example will display information on the cost of each user's first order, sorted by user IDs.
source food_orders
| chart first(total_price) by user_id
The example will display information on the average order value of each user, sorted by user IDs.
source food_orders
| chart avg(total_price) by user_id
The example will display information on the cost of each user's last order, sorted by user IDs.
source food_orders
| chart last(total_price) by user_id
The example will display information on the cost of each user's last order, sorted by user IDs.
source food_orders
| chart last(total_price) by user_id
The example will display information on the total cost of orders for each user, sorted by user IDs.
source food_orders
| chart sum(total_price) by user_id
stats
Performs statistical operations on data. The eventstats and streamstats commands are variations on the stats command
The query will display information on the maximum order value of each user, sorted by user IDs.
source food_orders
| stats max(total_price) as 'Maximum order price' by  user_id
| user-id | Maximum order price |
|---|---|
| 10 | 32,96 |
| 16 | 61.43 |
| 52 | 26.97 |
| 53 | 37.94 |
eventstats
Calculates the same statistics as the stats command and adds the result of the calculation to each event instead of overwriting all events. When the next search is run, it returns a list of events instead of a results table because the eventstats command does not modify the raw data.
In the example the eventstats command will calculate the sum of all user requests (grouped by the source.ip field) and write it to each event in the total_count field. Next, the head command will leave 10 entries with the largest number of requests, and finally the percentage of user requests out of the total number of requests will be calculated.
source sm_cs_web_indexes
| stats count as count_by_ip by source.ip
| sort -count_by_ip
| eventstats sum(count_by_ip) as total_count
| head 10
| eval percent = round((count_by_ip / total_count * 100), 2)
| table source.ip, count_by_ip, percent
| rename source.ip as "Source ip", count_by_ip as "Number of requests from source", percent as "Процент от общего числа запросов"
| source id | Number of requests from source | Percentage of total requests |
|---|---|---|
| 192.168.12.130 | 3 | 0.3 |
| 192.168.12.119 | 3 | 0.3 |
| 192.168.12.205 | 2 | 0.2 |
| 192.168.12.5 | 2 | 0.2 |
streamstats
Calculates statistics for each event as it is viewed in real time.
The streamstats command calculates statistics for each event, taking into account only those events that were previously processed:
window- limits the maximum number of events that will be used when calculating statistics. Default value: 0 (unlimited)reset_before– accepts anevalexpression that returns a Boolean value. If it is true, the window is reset and statistics are then calculatedreset_after- accepts anevalexpression that returns aBooleanvalue. If it is true, the statistics are calculated and then the window is resetreset_on_change– resets the window if the value of at least one of the by fields has changed
A query that will record the number of packets between the source ip and the destination ip. First, we will filter out events in which the number of packets is null, then we will sort the data in ascending timestamp order. The streamstats command will record the destination ip and packet count. The reset_on_change = true argument means that when the source.ip field changes, the statistics will be reset and recalculated.
source apache-*
| where isnotnull (http.response.body.bytes)
| sort +'@timestamp'
| streamstats list(destination.address) as destination_address, sum(http.response.body.bytes) as http.response.body.bytes by source.ip reset_on_change = true
| table destination_address, http.response.body.bytes, source.ip
| rename destination_address as "Destination IP", http.response.body.bytes as "Number of packages", source.ip as "Source IP"
| Destination IP | Number of packages | Source IP |
|---|---|---|
| 69.79.101.91 | 3 | 199.121.187.7 |
| 219.49.63.171 | 2 | 133.105.151.123 |
| 201.223.91.139 | 7 | 133.215.169.45 |
| 77.65.7.47 | 7 | 69.187.155.231 |
| 129.83.215.165 | 6 | 121.65.33.45 |
| 219.49.63.171 | 2 | 133.105.151.123 |