Zabbix: Asset-Service Model ASM
Overview
The Zabbix module can automatically build a Asset-Service Model (hereafter ASM) based on existing Zabbix groups.
Each host group forms a separate service in the model with corresponding metrics. Thus, ASM allows tracking the state of the infrastructure and identifying service-level degradations.
For more details on model configuration, refer to the corresponding section Configuring Zabbix ASM and Inventory.
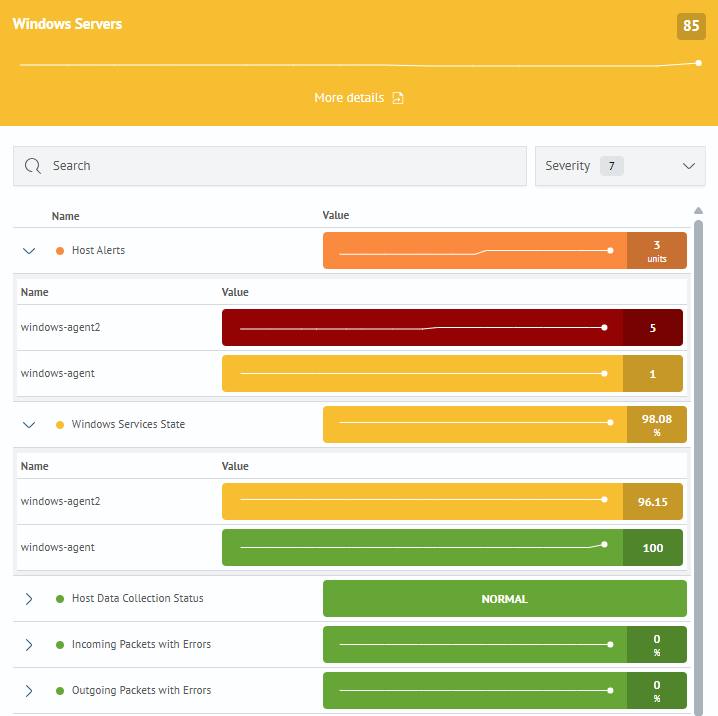
Service Metrics
The following metrics are generated for each service:
| Metric | Description |
|---|---|
| Alerts on Host | Number of current alerts |
| Host Data Collection Status | Availability of data from hosts |
| Incoming Packets with Errors | Number of erroneous incoming packet |
| Outgoing Packets with Errors | Number of erroneous outgoing packets |
| Windows Services State | Current state of system services |
Metrics are calculated for each host and aggregated at the service level.
For more details on calculation principles, see the corresponding article Metric.
Service Dependencies
The service hierarchy is built based on Zabbix groups:
- a base service is created: Zabbix: Infrastructure Status
- services for Linux, Windows, and Zabbix server are created based on host groups
ASM Visualization
Two display modes for ASM are available to analyze service statuses and their dependencies:
-
ASM Tree
- In the
ASM Tree: (Main menu-Asset service model 2.0-Asset service model) 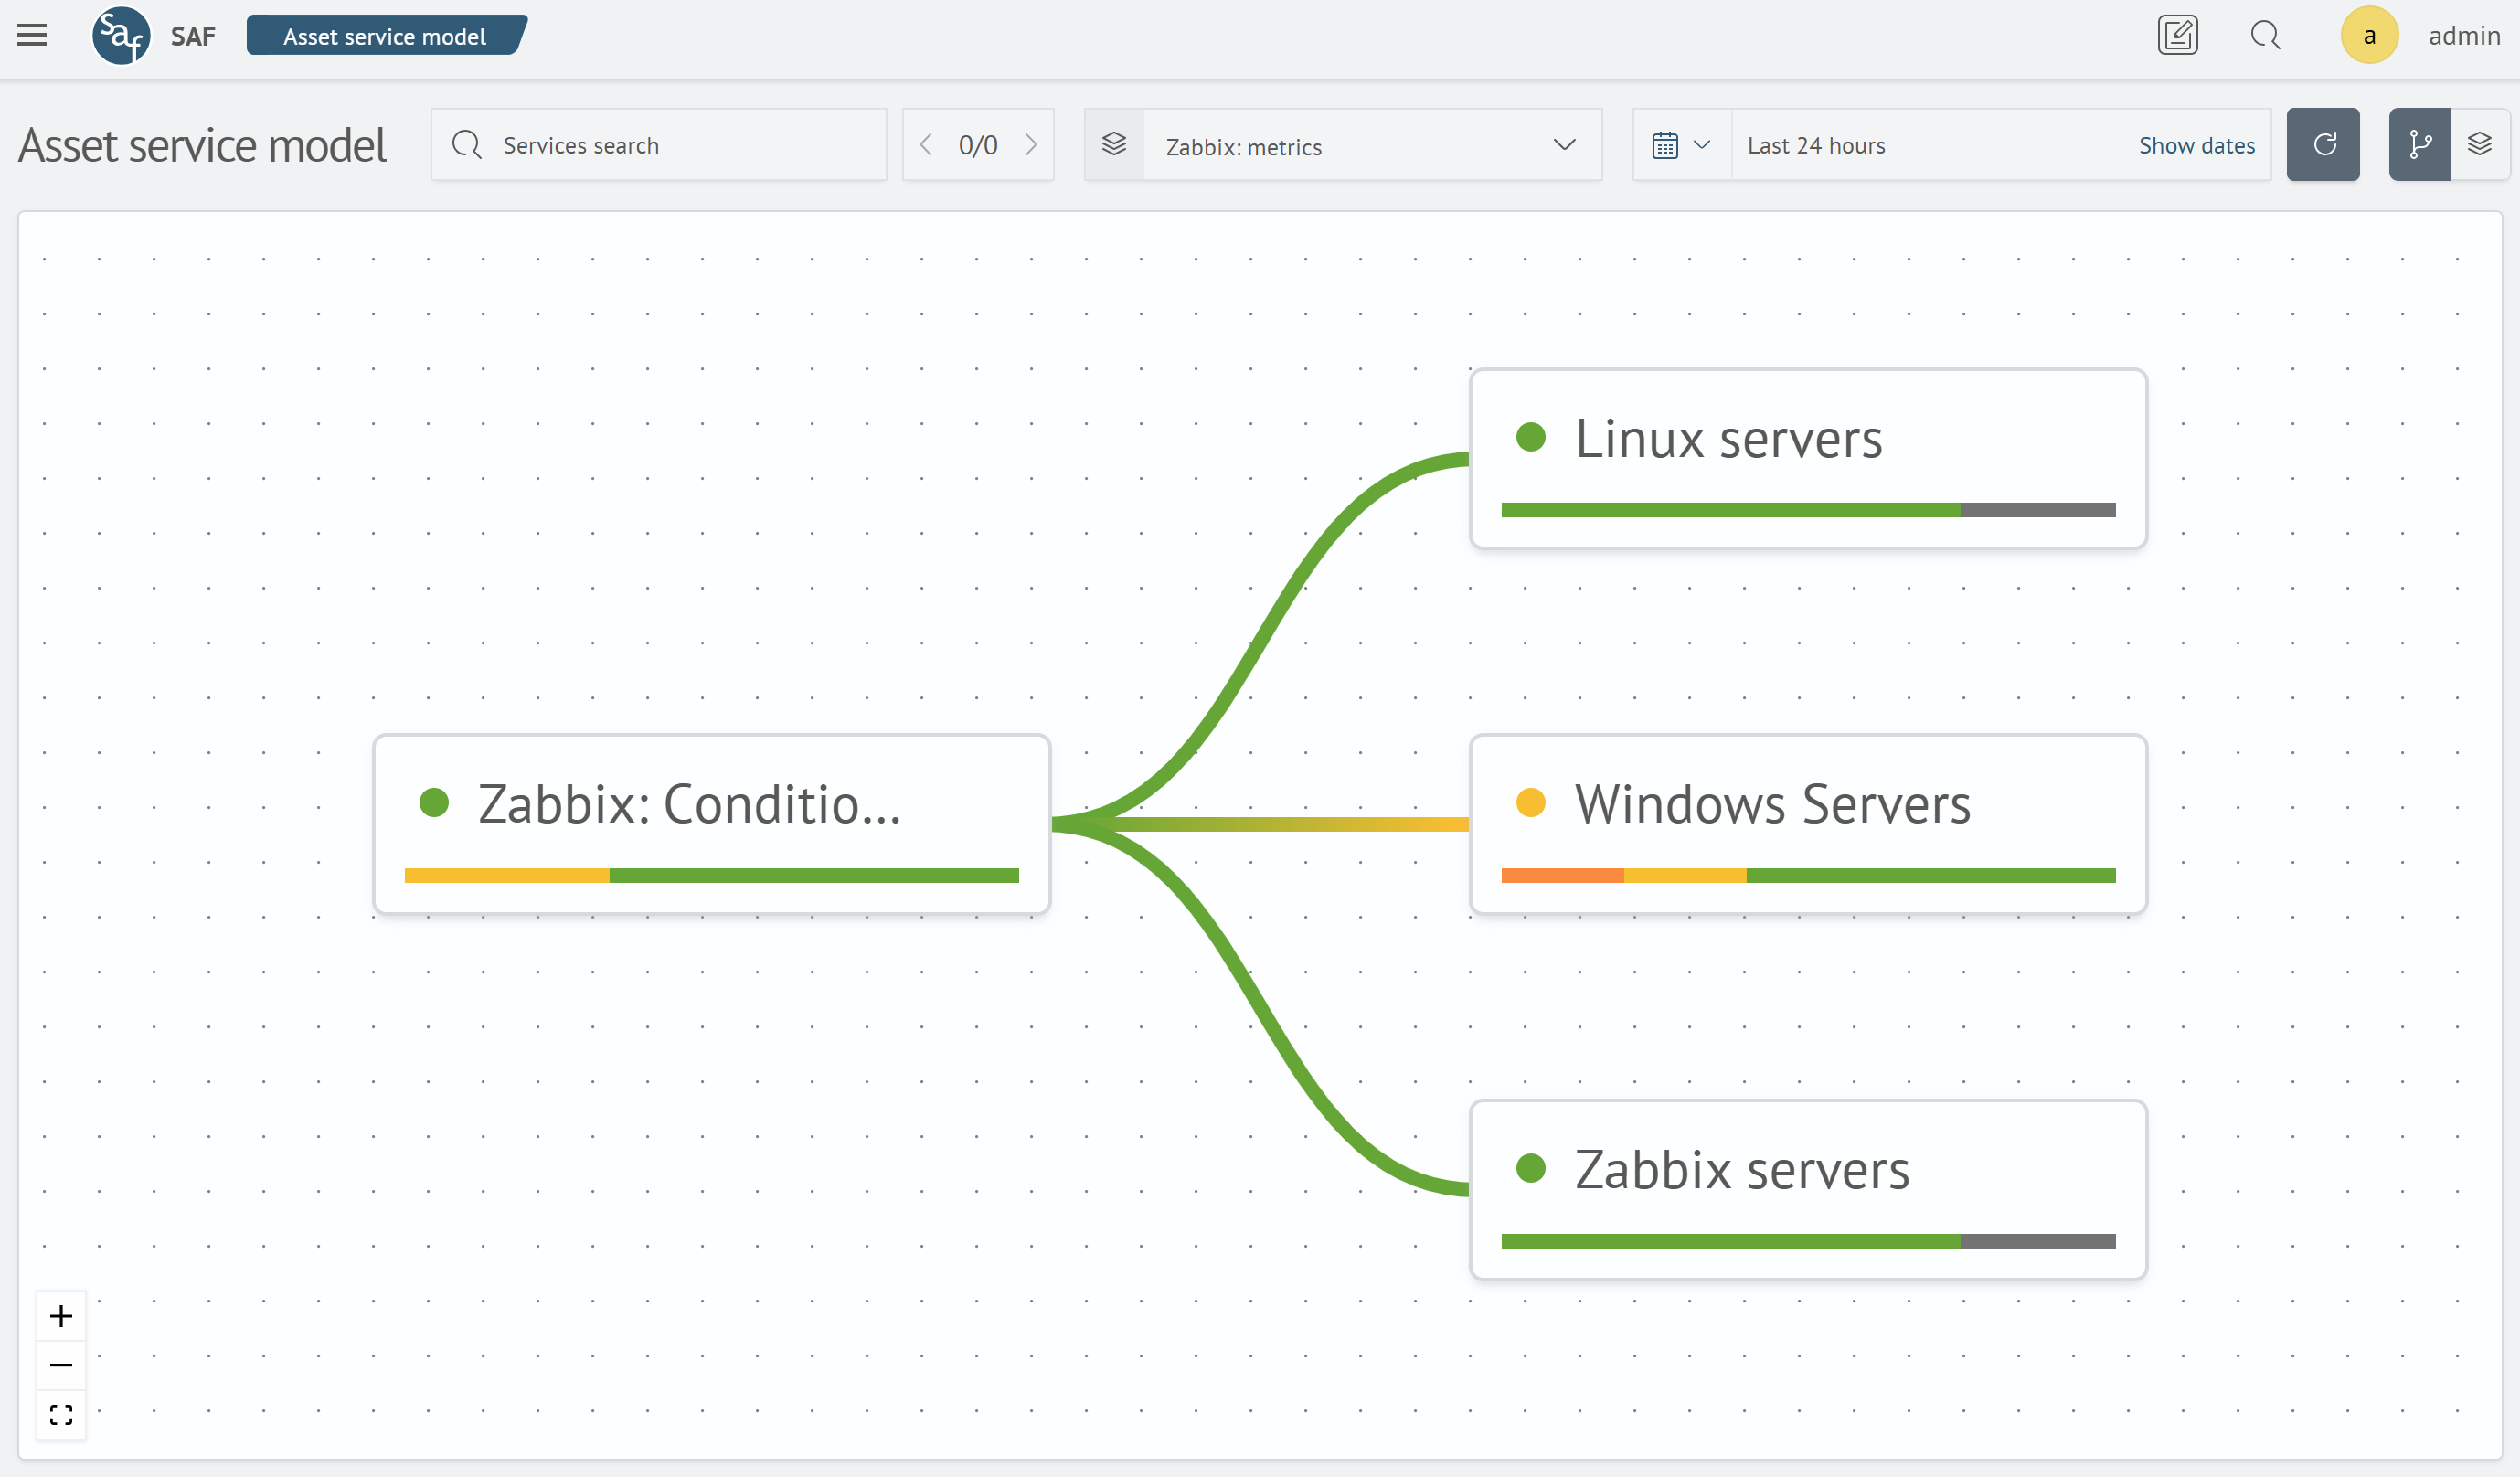
- In the
-
Layers
- In the
Layers: (Main menu-Asset service model 2.0-Layers) 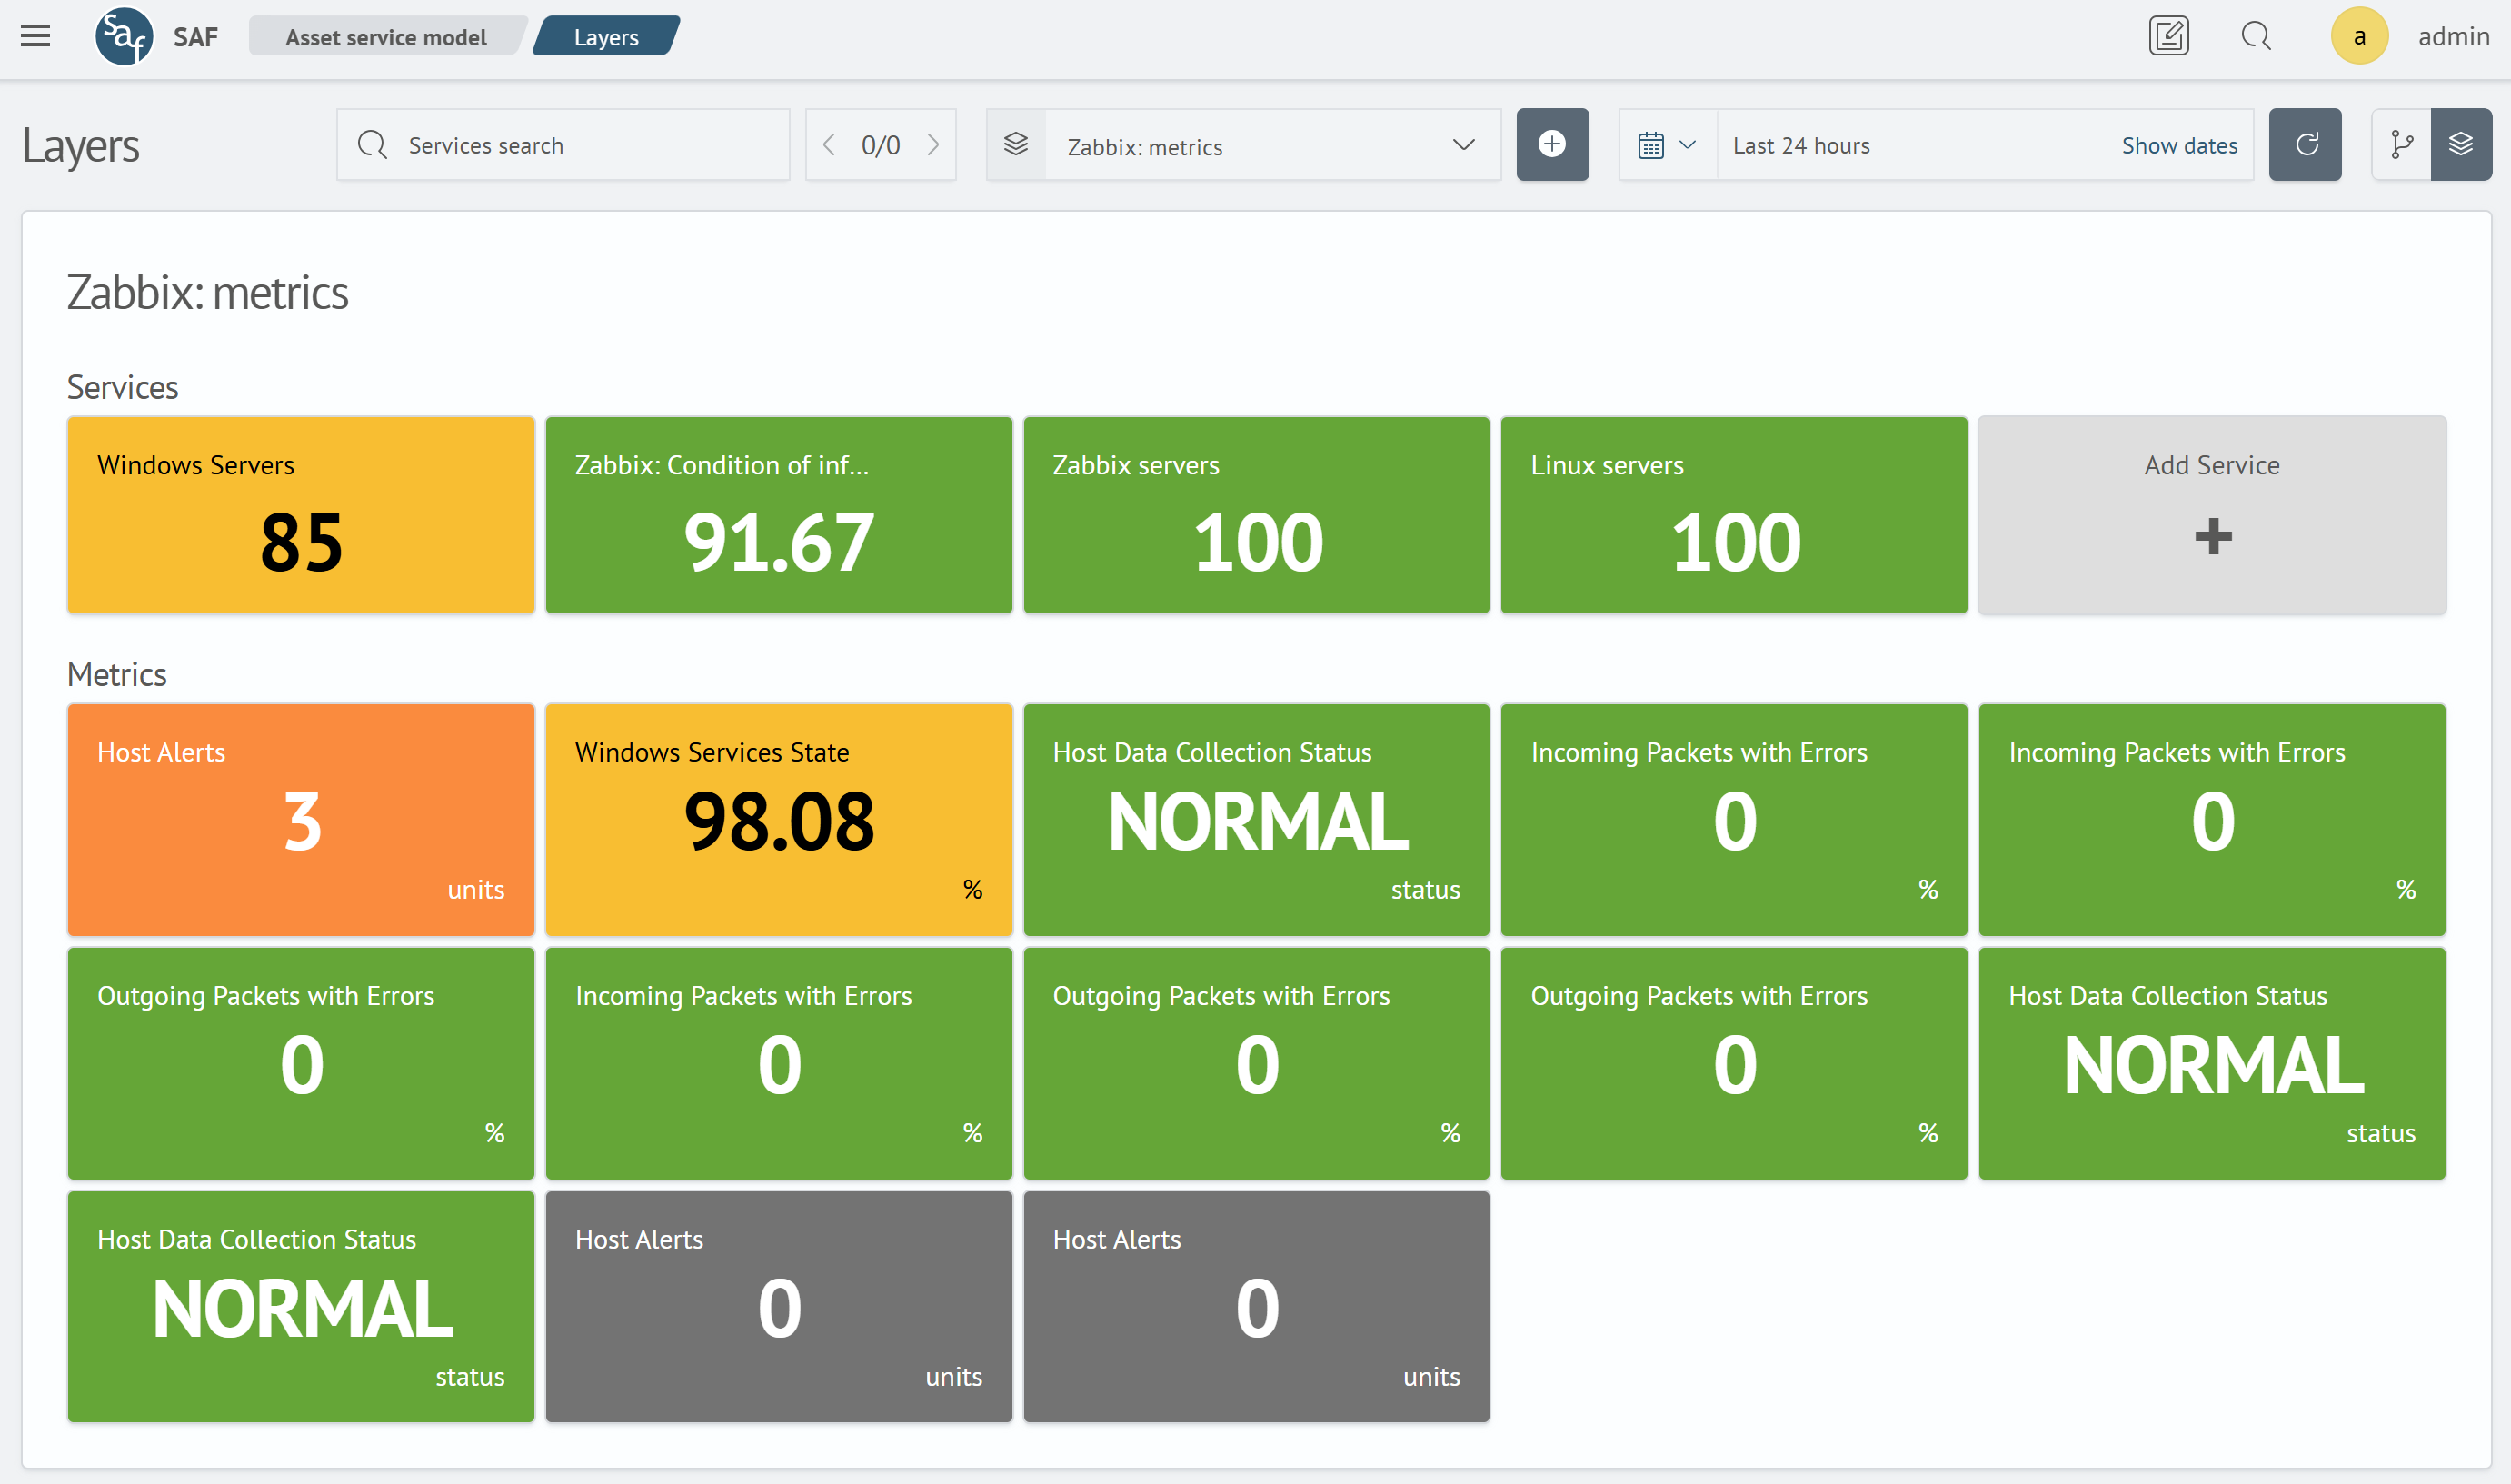
- In the
🗃️ Zabbix: Dashboards
4 items
📄️ Zabbix: ASM
Creation and purpose of the Asset-Service Model (ASM) for monitoring Zabbix infrastructure.
📄️ Zabbix: Inventory
Purpose, structure, and interface of host and resource inventory in the Zabbix module.
📄️ Zabbix: Integration with Incident Manager
Automatic registration of incidents based on Zabbix alerts and triggers in the Incident Manager.