Windows and Linux Agent Dashboards
Overview
The Zabbix: Windows Agent and Zabbix: Linux Agent dashboards are designed for monitoring the status and performance of individual agents. They allow you to analyze resource load, control system parameters, and track summary metrics for each node.
Main Sections
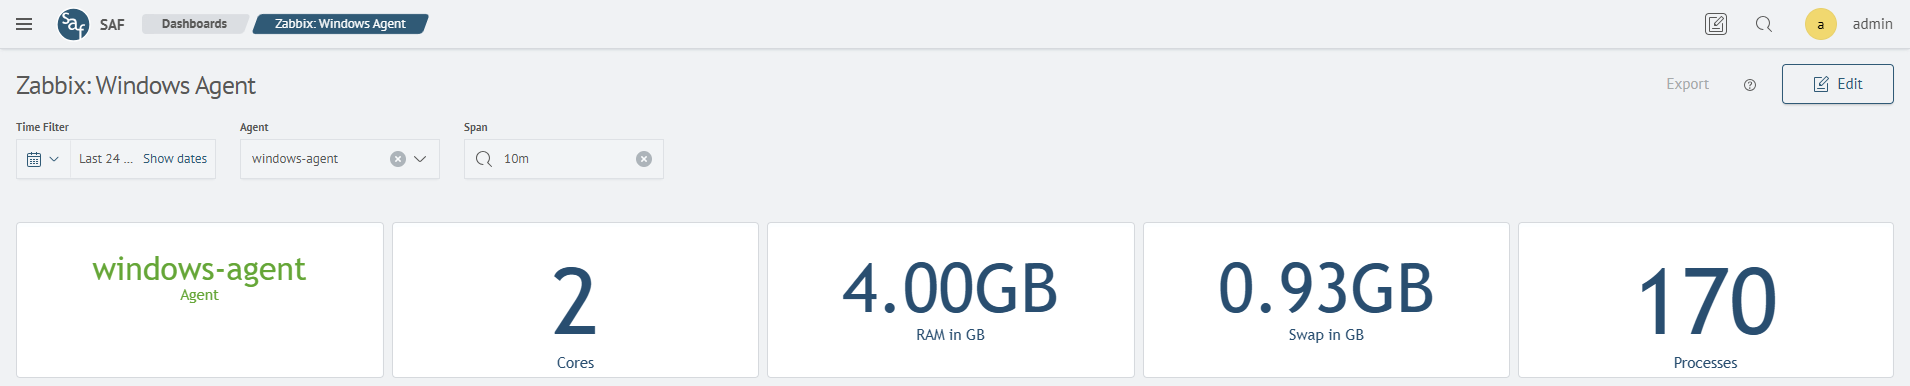
Agent General Parameters
Displays system information about the selected agent:
- CPU core count
- RAM and swap memory size
- number of active processes
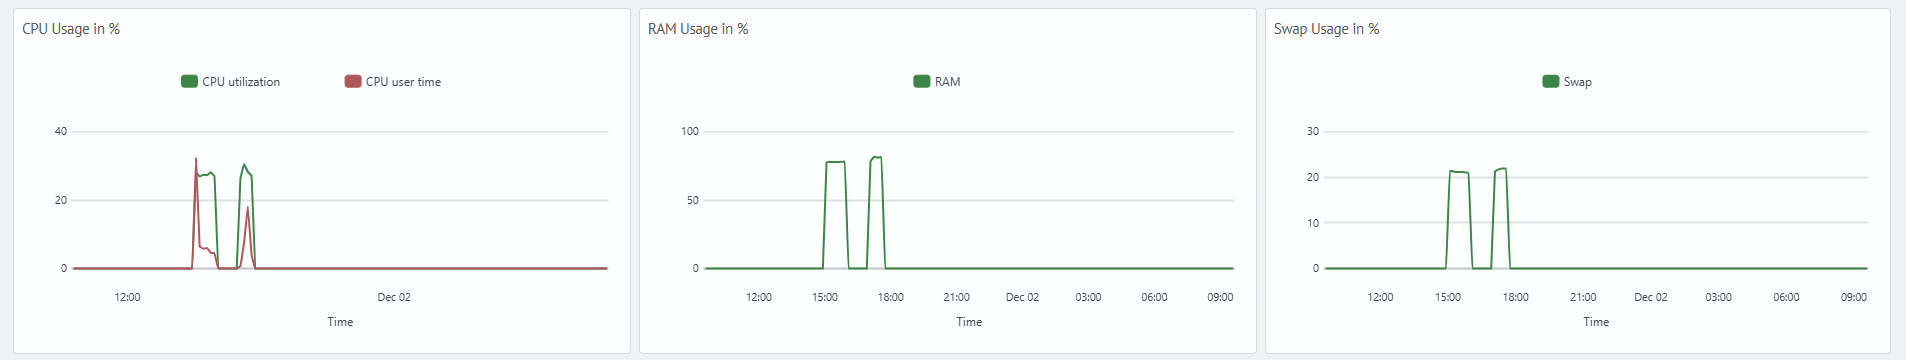
System Performance
Displays the usage dynamics of key resources:
- CPU load
- RAM usage
- Swap usage
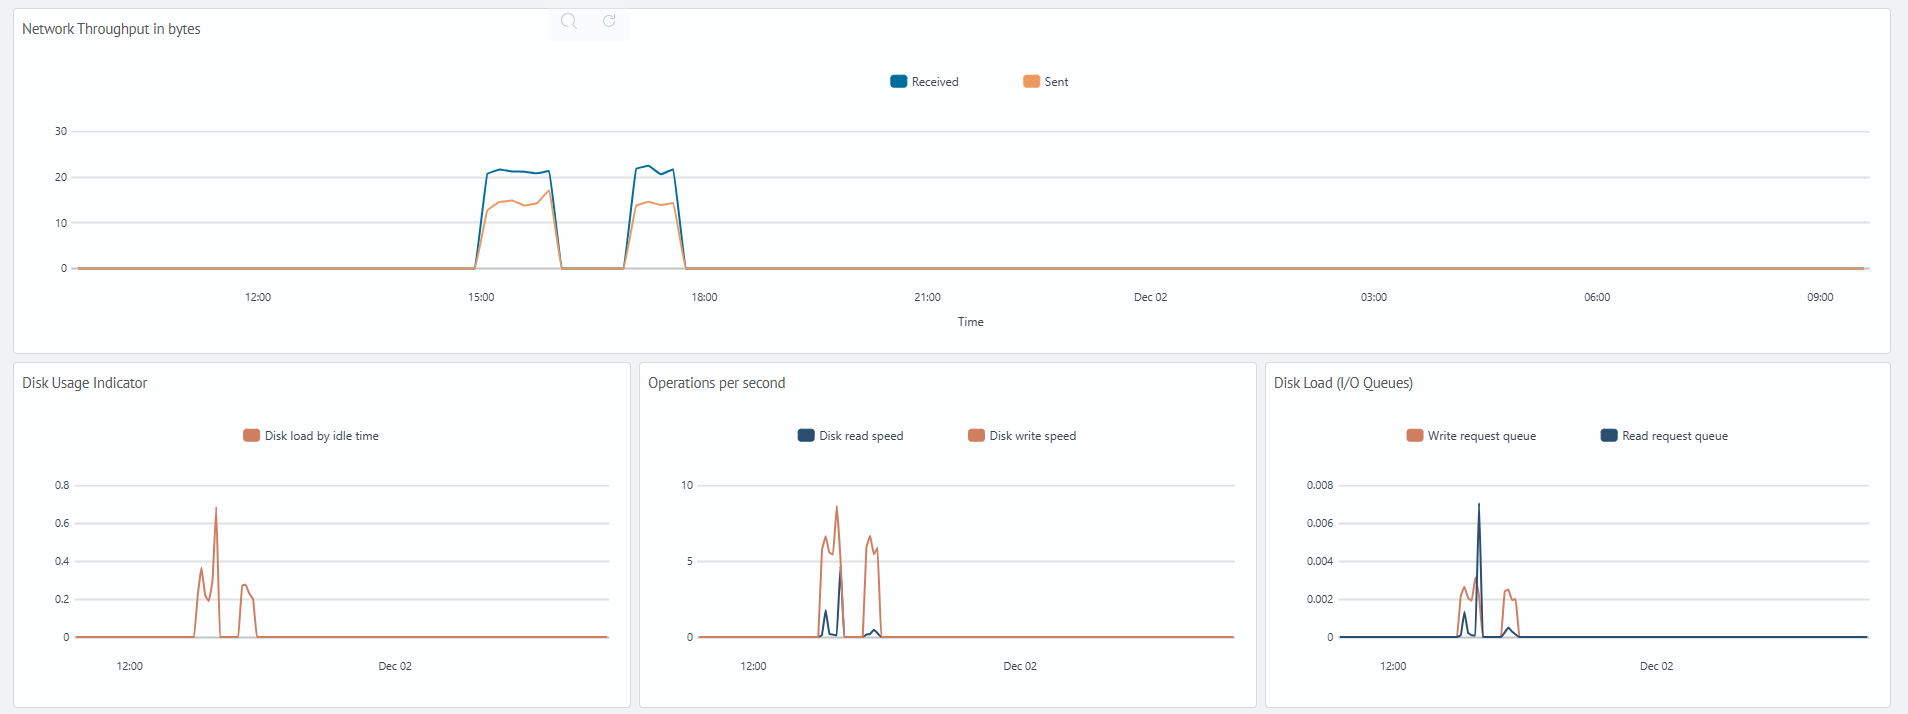
Network and Disk Activity
Visualizes network traffic and disk subsystem performance indicators:
- volume of data sent and received
- disk load level
- read and write operation speeds
- input/output request queue length
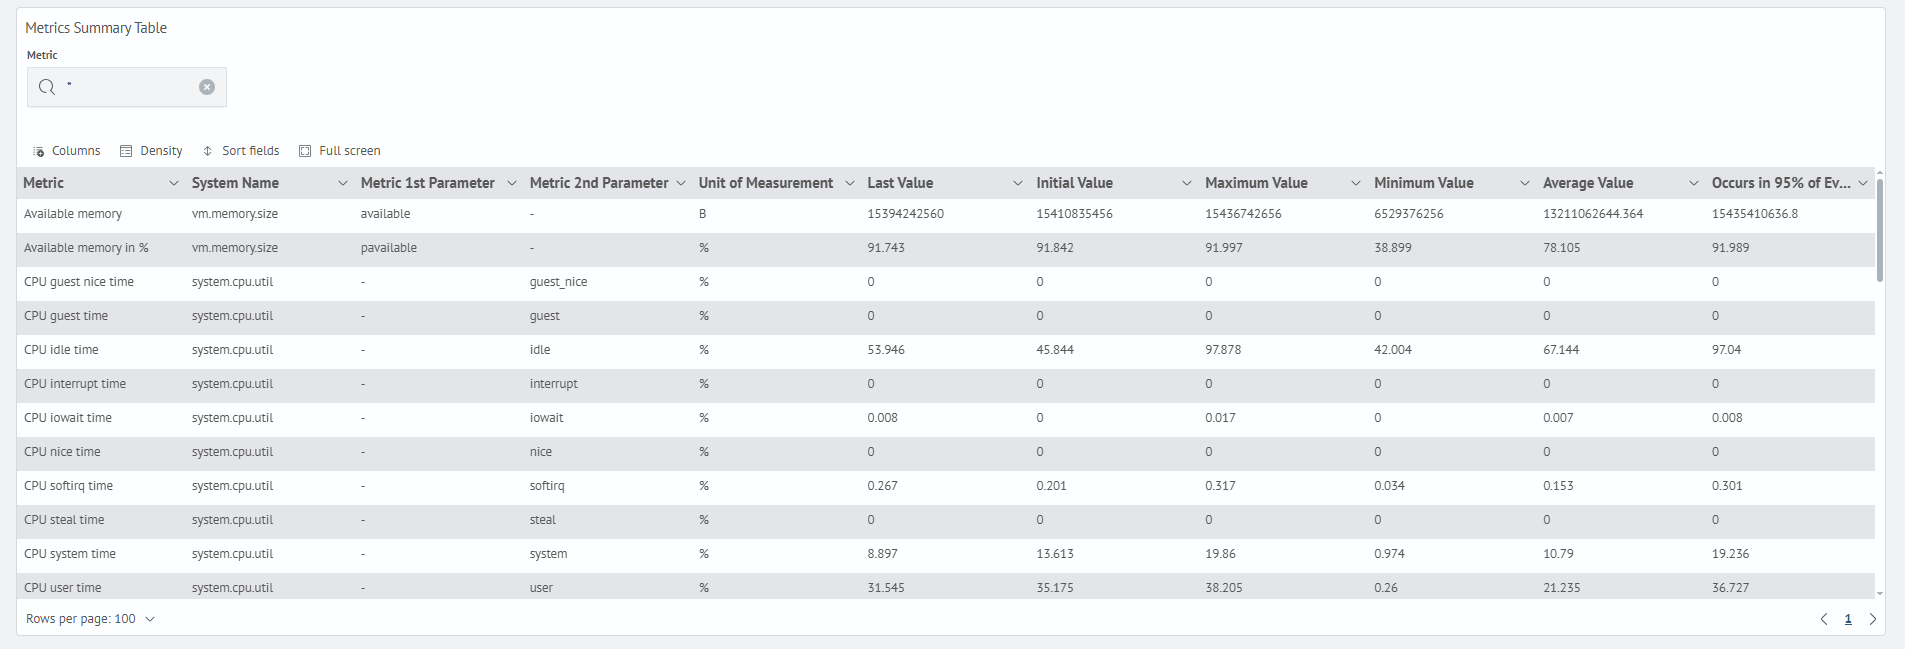
Summary Metrics Table
Allows viewing detailed metrics collected by the agent:
- metric parameters and units of measurement
- last, maximum, minimum, and average values
- 95th percentile
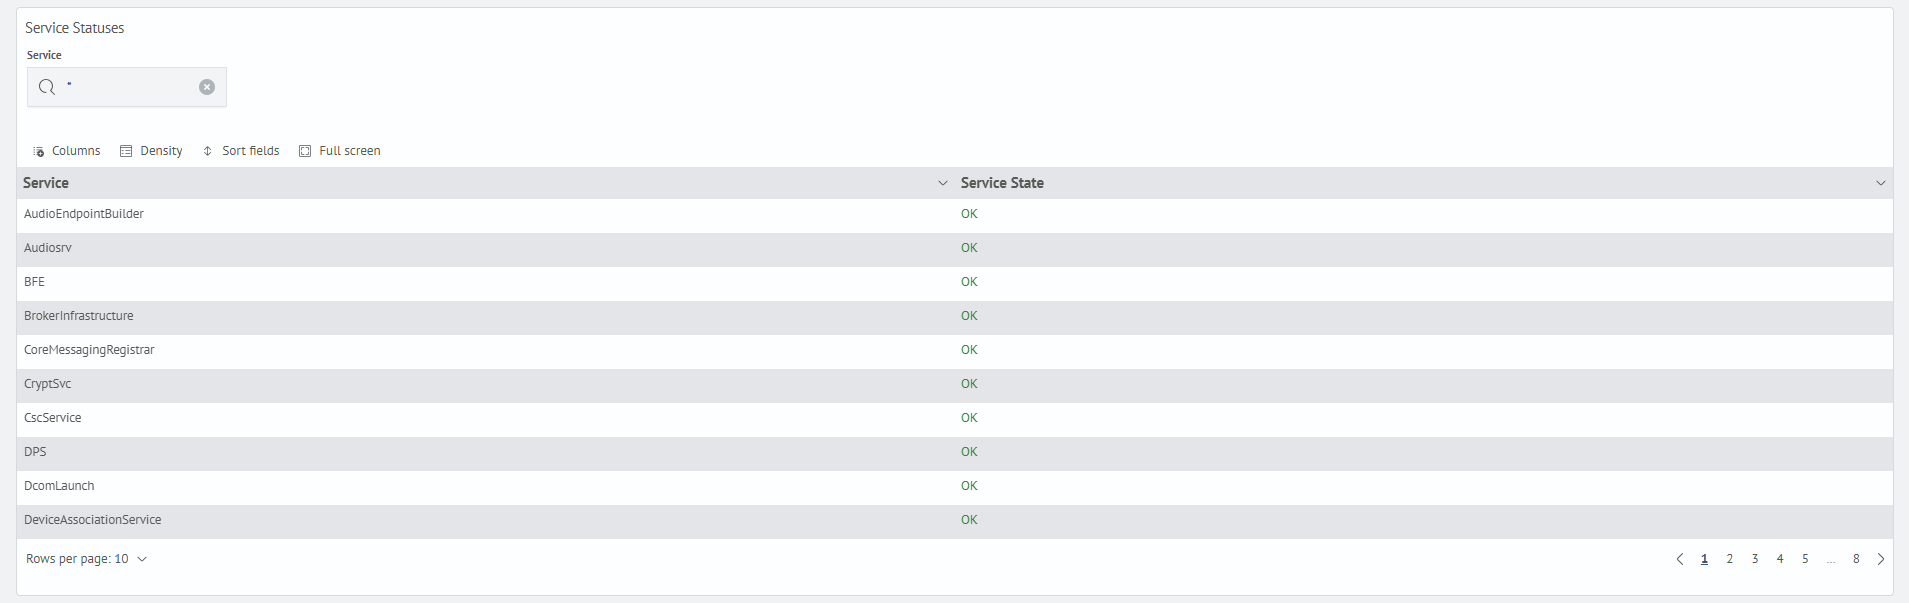
Service Statuses
Displays the current state of system services on a Windows agent:
- service
- service state