Alerts Dashboard
Overview
The Zabbix: Alerts dashboard is designed for analyzing events and incidents registered by the monitoring system. It provides statistics on alert severity, statuses, and types, as well as their occurrence dynamics.
Main Sections
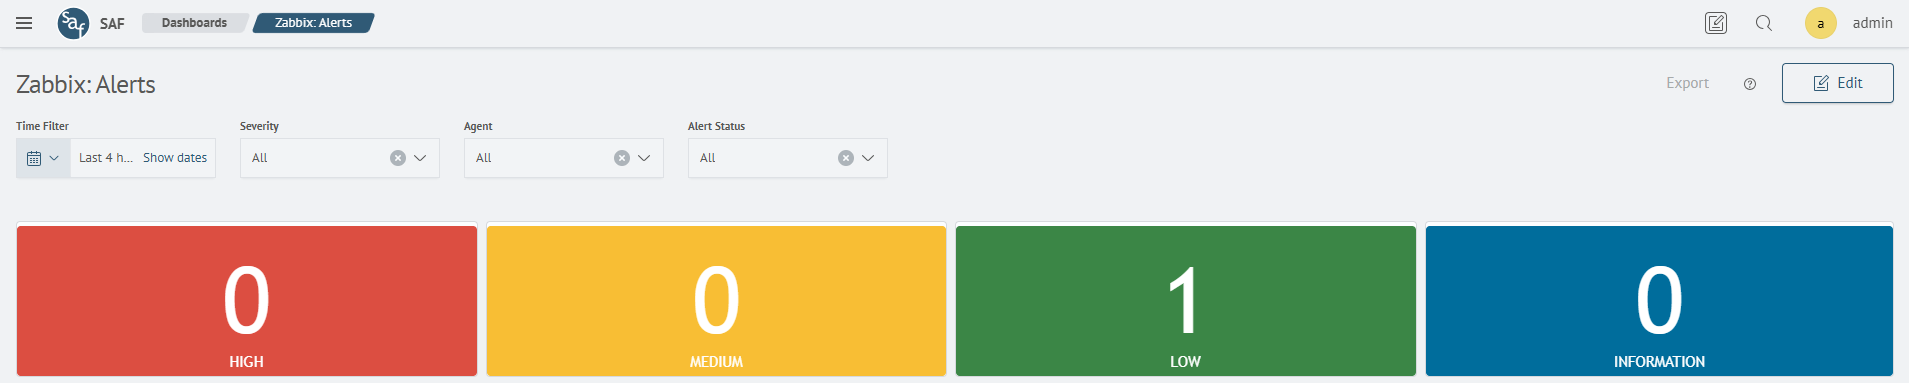
Severity Statistics
Displays the current count of active alerts by levels:
- High
- Medium
- Low
- Information
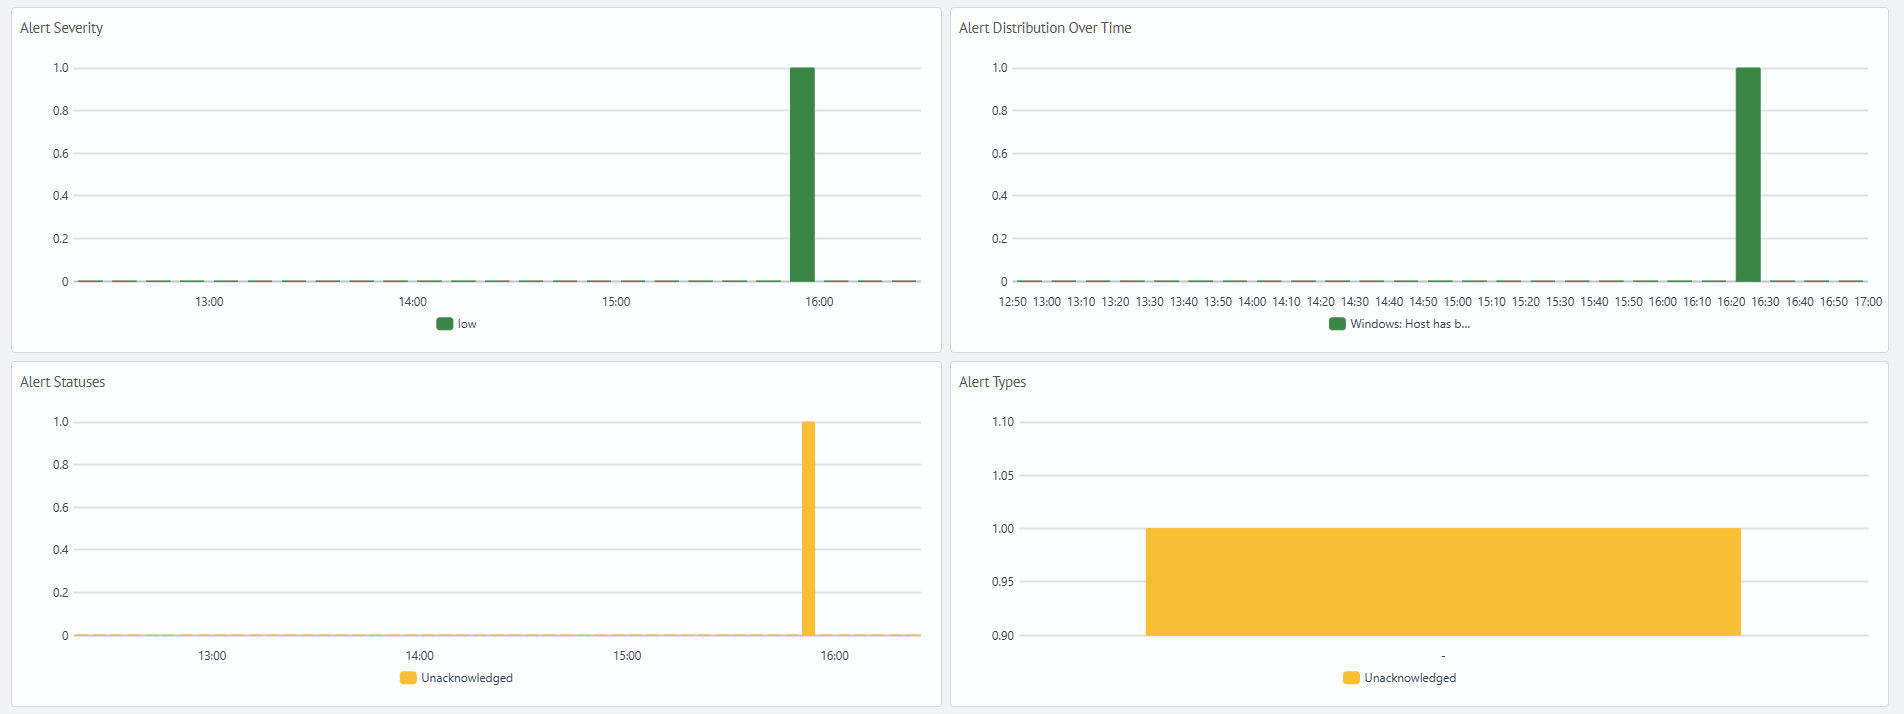
Alert Analytics
Displays summary statistics for all registered incidents:
- Alert Severity: distribution of events by level
- Alert Distribution Over Time: dynamics of alert occurrences over the selected period
- Alert Statuses: ratio of acknowledged and unacknowledged events
- Alert Types: classification of events by category
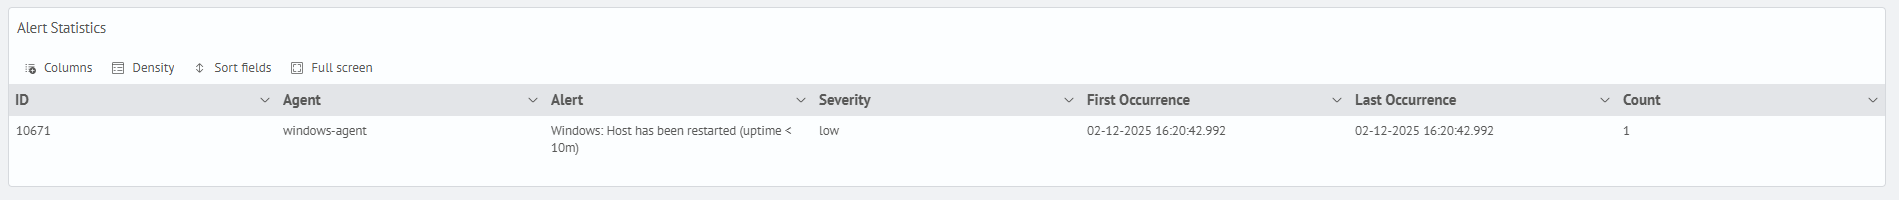
Alert Statistics Table
Contains detailed data for each registered incident:
- agent ID and name
- alert description
- severity level and alert count
- time of first and last trigger