Agents and Configuration Dashboard
Overview
The Zabbix: Agents and Configuration dashboard is designed for analyzing the status of agents, connected hosts, and their configuration parameters. It allows you to control node availability, track current metrics, and identify agent operational issues.
Main Sections
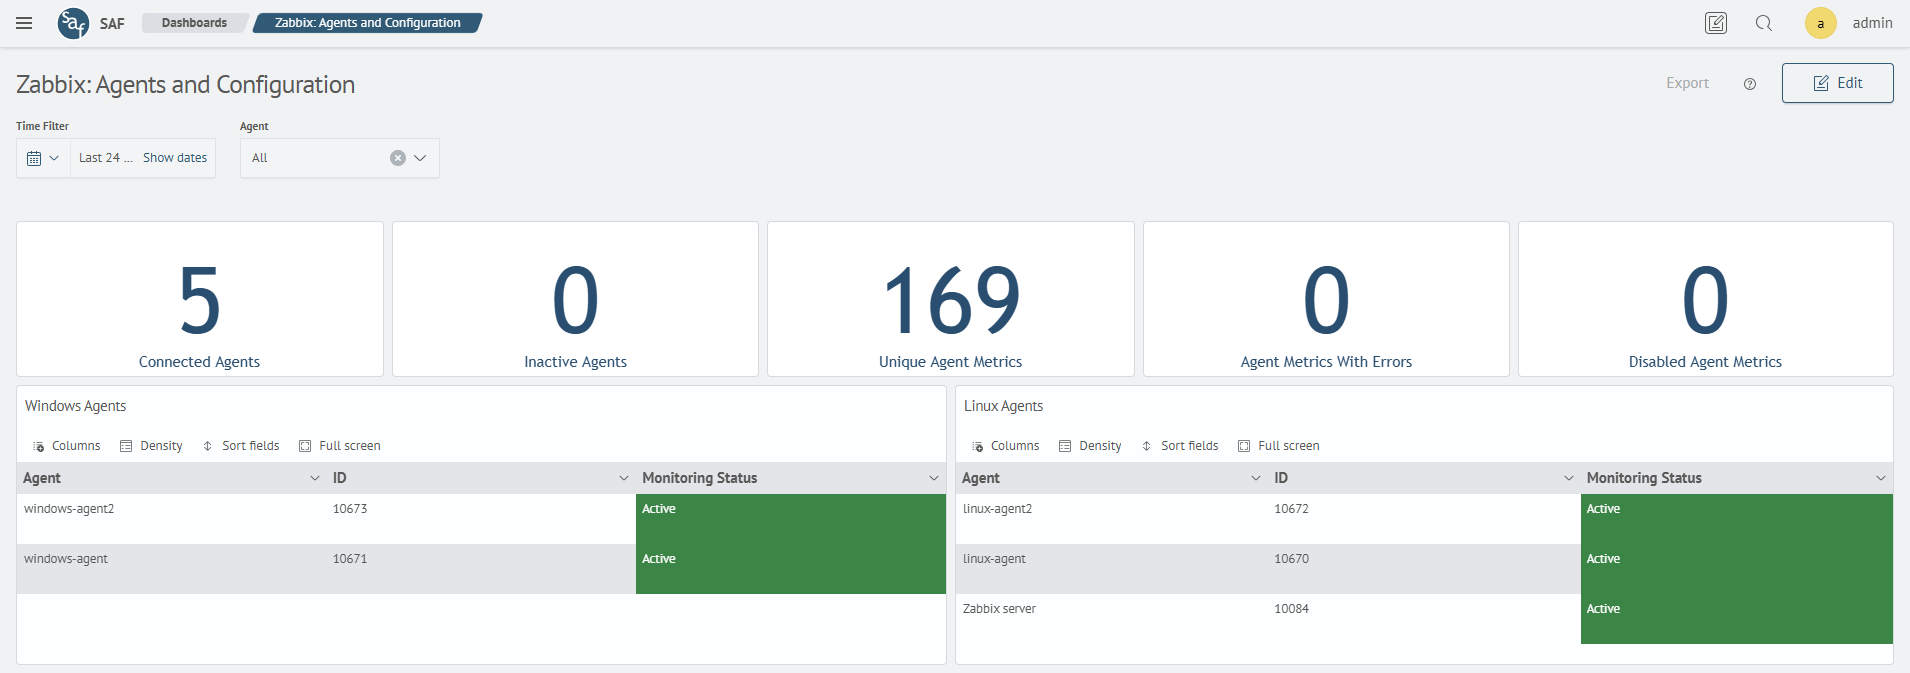
General Parameters
Displays key agent performance indicators:
- number of active and inactive agents
- count of unique and inactive metrics
- number of metrics with errors
- overall agent monitoring status
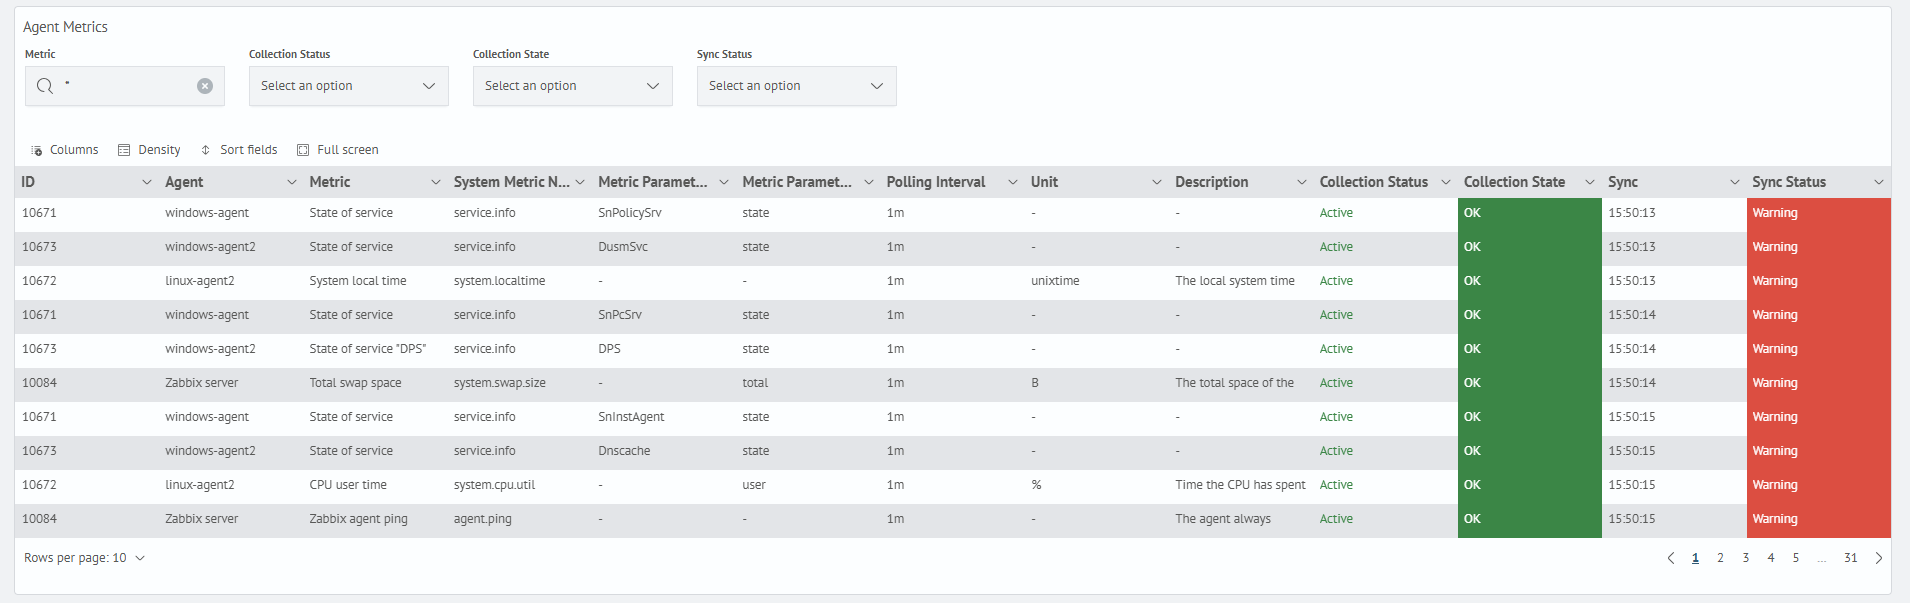
Agent Metrics Table
Displays detailed information about the metrics collected by each agent:
- metric name and unit of measurement
- polling interval
- data collection status and state
- server synchronization status
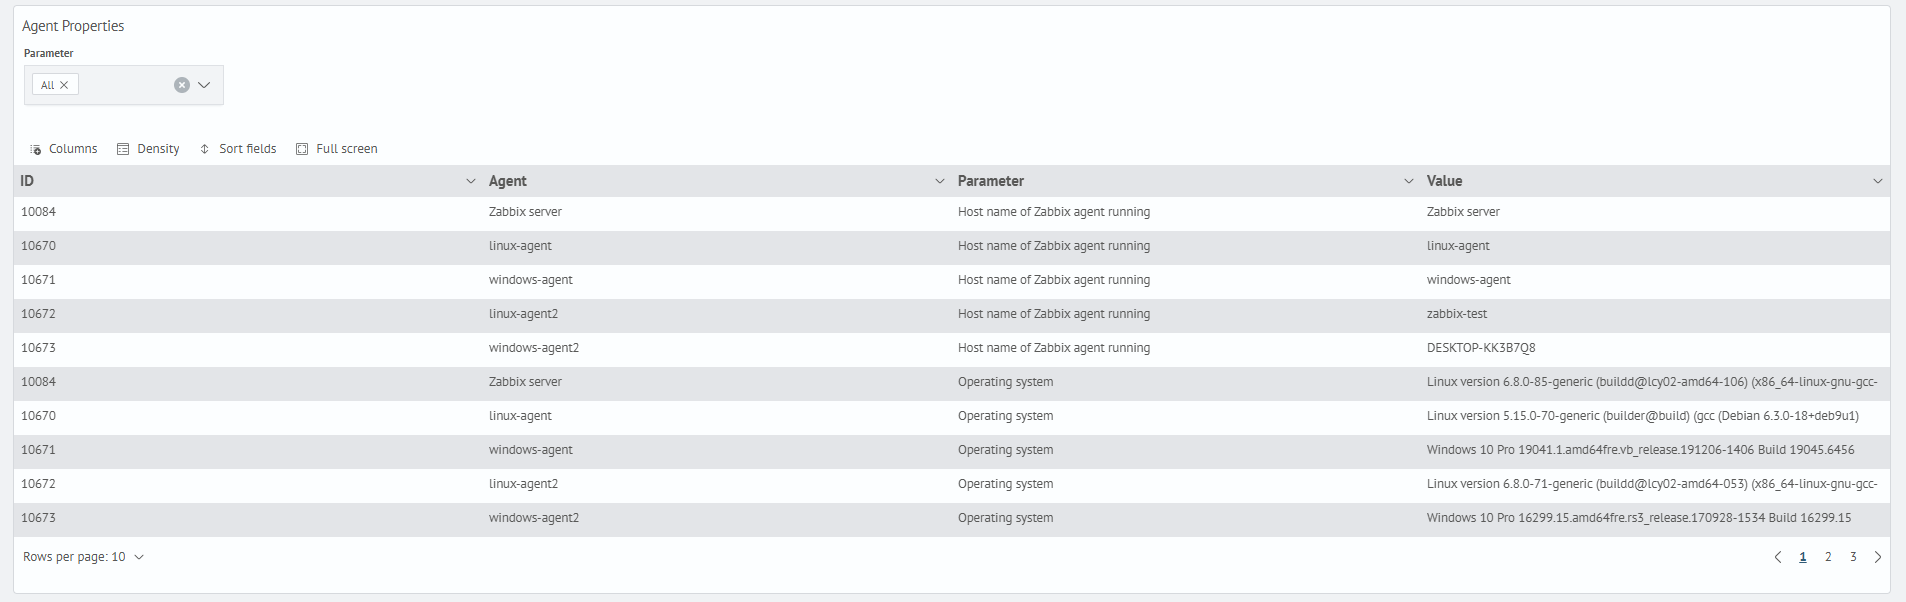
Agent Properties Table
Displays system and configuration parameters obtained from the agents:
- agent name
- parameter (agent version, operating system, architecture, system name)
- current parameter value
Navigation
Selecting an agent in the Windows Agents or Linux Agents tables navigates to the corresponding dashboard:
- Zabbix: Windows Agent — displays detailed information about the selected Windows agent, including system parameters, CPU usage, memory, swap, and network activity
- Zabbix: Linux Agent — displays detailed information about the selected Linux agent, including core count, CPU usage, RAM, swap, process count, and a summary metrics table