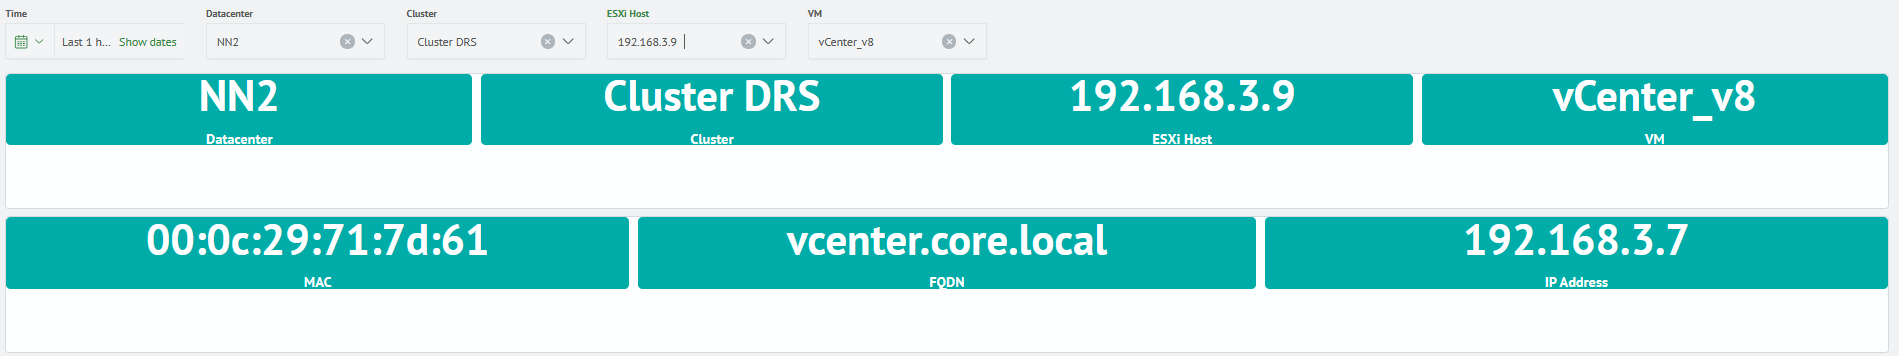
VM Target Info
Description
The VM Target Info section of the module is intended to display the data relating to any chosen virtual machine on the cluster.
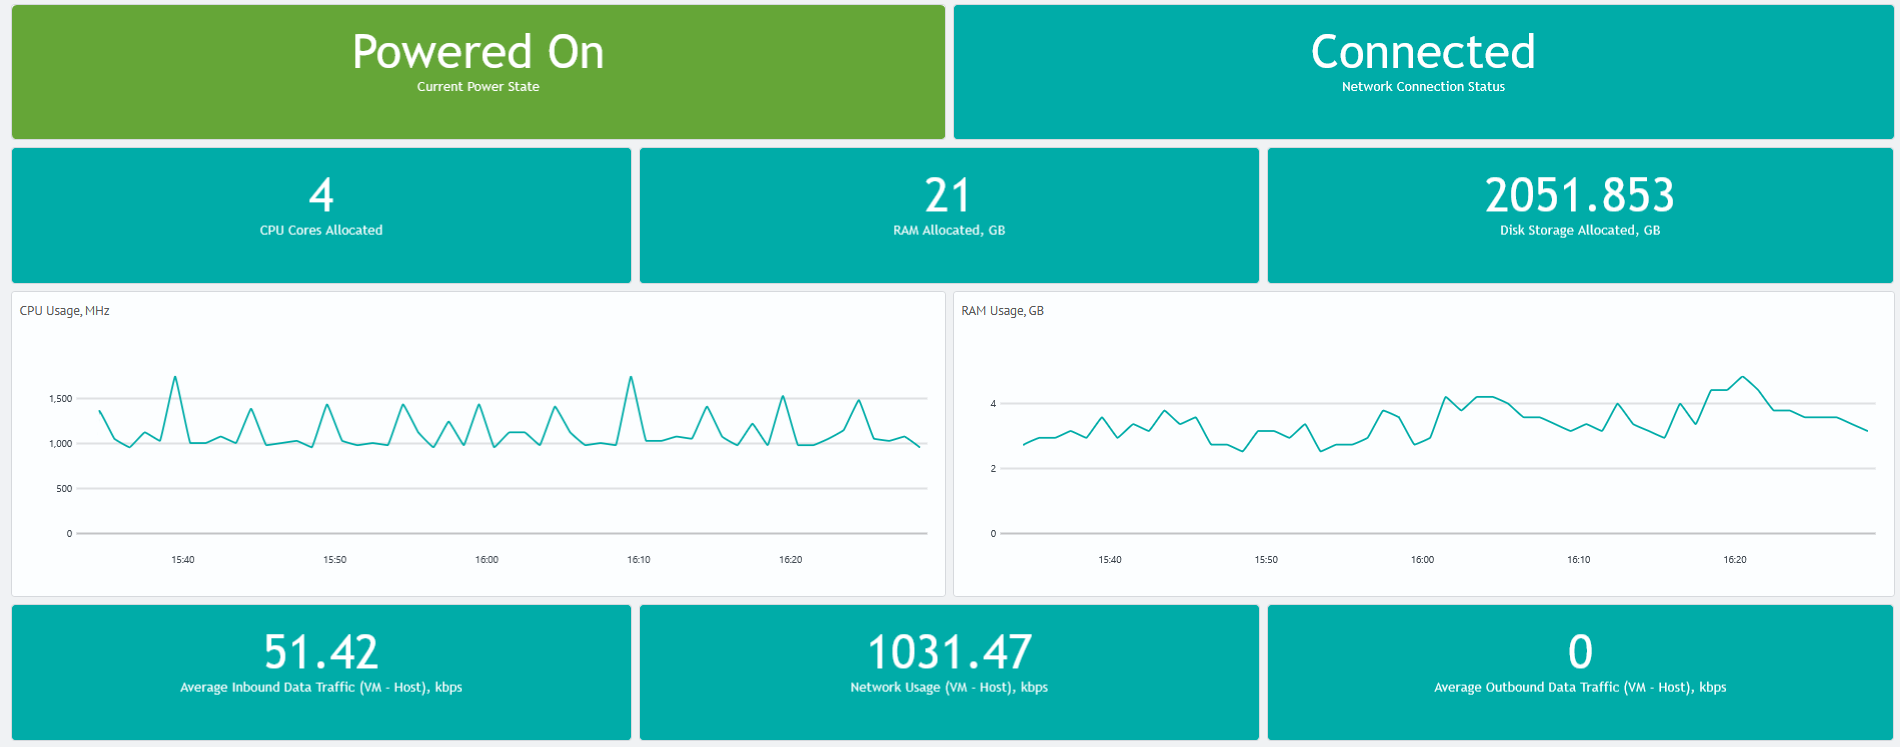
Displayed Data
- current power state of the chosen virtual machine (Powered On or Off)
- current network connection state of the chosen virtual machine (Connected or Disconnected)
- number of CPU cores for the chosen virtual machine
- RAM (in GB) allocated for the chosen virtual machine
- disk size (in GB) allocated for the chosen virtual machine
- chart of the active CPU usage for the chosen virtual machine
- chart of the active RAM usage (in GB) for the chosen virtual machine
- average inbound data traffic between the chosen virtual machine and its ESXi host
- current general network usage of the connection between the chosen virtual machine and its ESXi host
- average outbound data traffic between the chosen virtual machine and its ESXi host
Dashboard List
- Current Power State
- Network Connection Status
- CPU Cores Allocated
- RAM Allocated, GB
- Disk Storage Allocated, GB
- CPU Usage, MHz
- RAM Usage, GB
- Average Inbound Data Traffic (VM - Host), kbps
- Network Usage (VM - Host), kbps
- Average Outbound Data Traffic (VM - Host), kbps