Troubleshooting
Description
The Troubleshooting section of the module is intended to provide data capable of assisting with identifying potential points of failure on the cluster.
Displayed Data
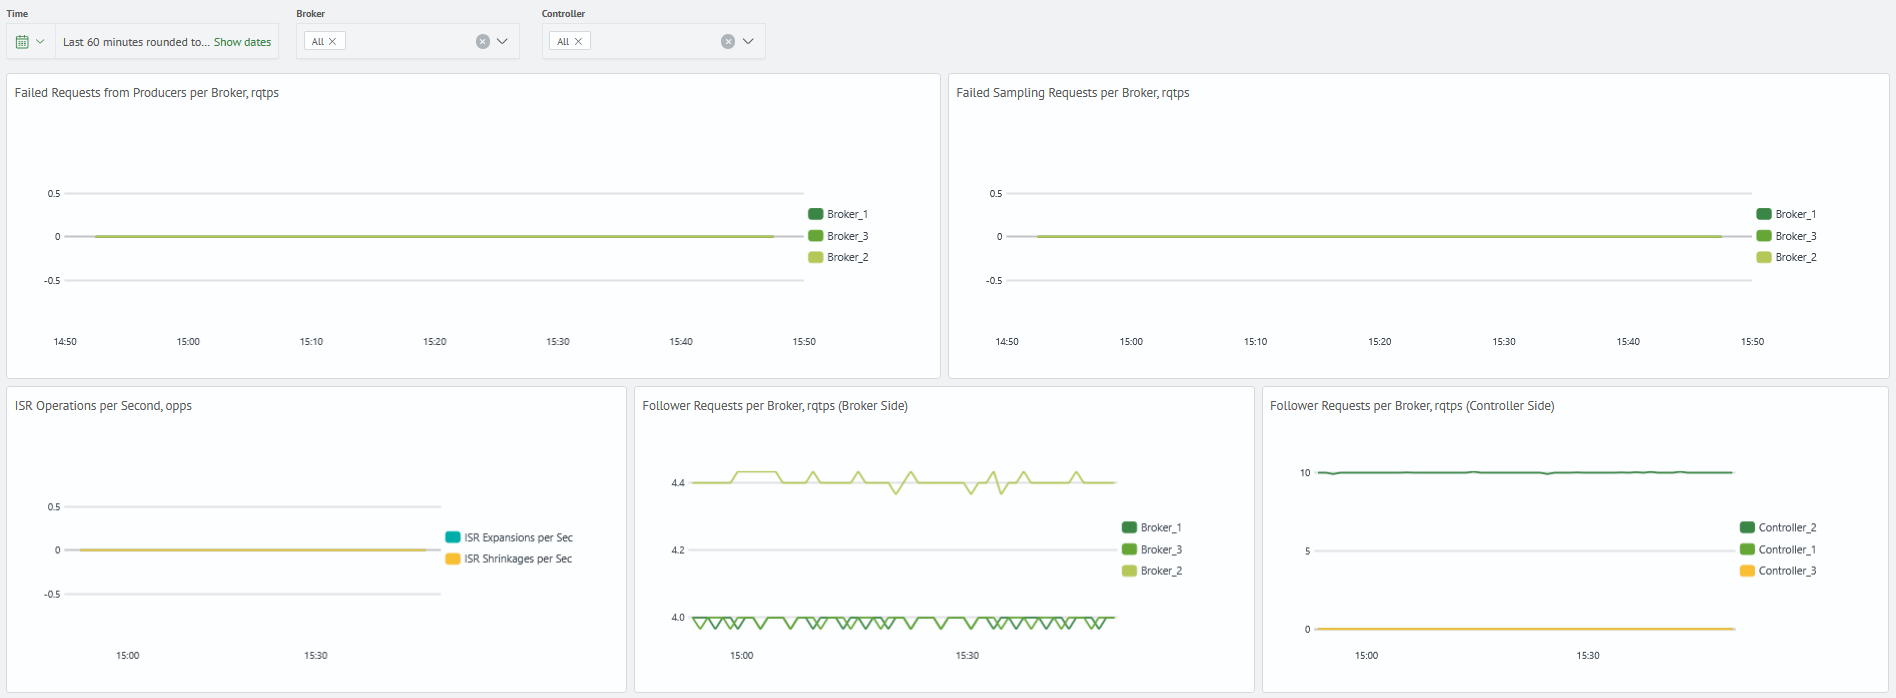
- metric charts for failed requests
- failed requests from producers for every broker per second
- failed sampling requests for every broker per second
- metric charts for general cluster load
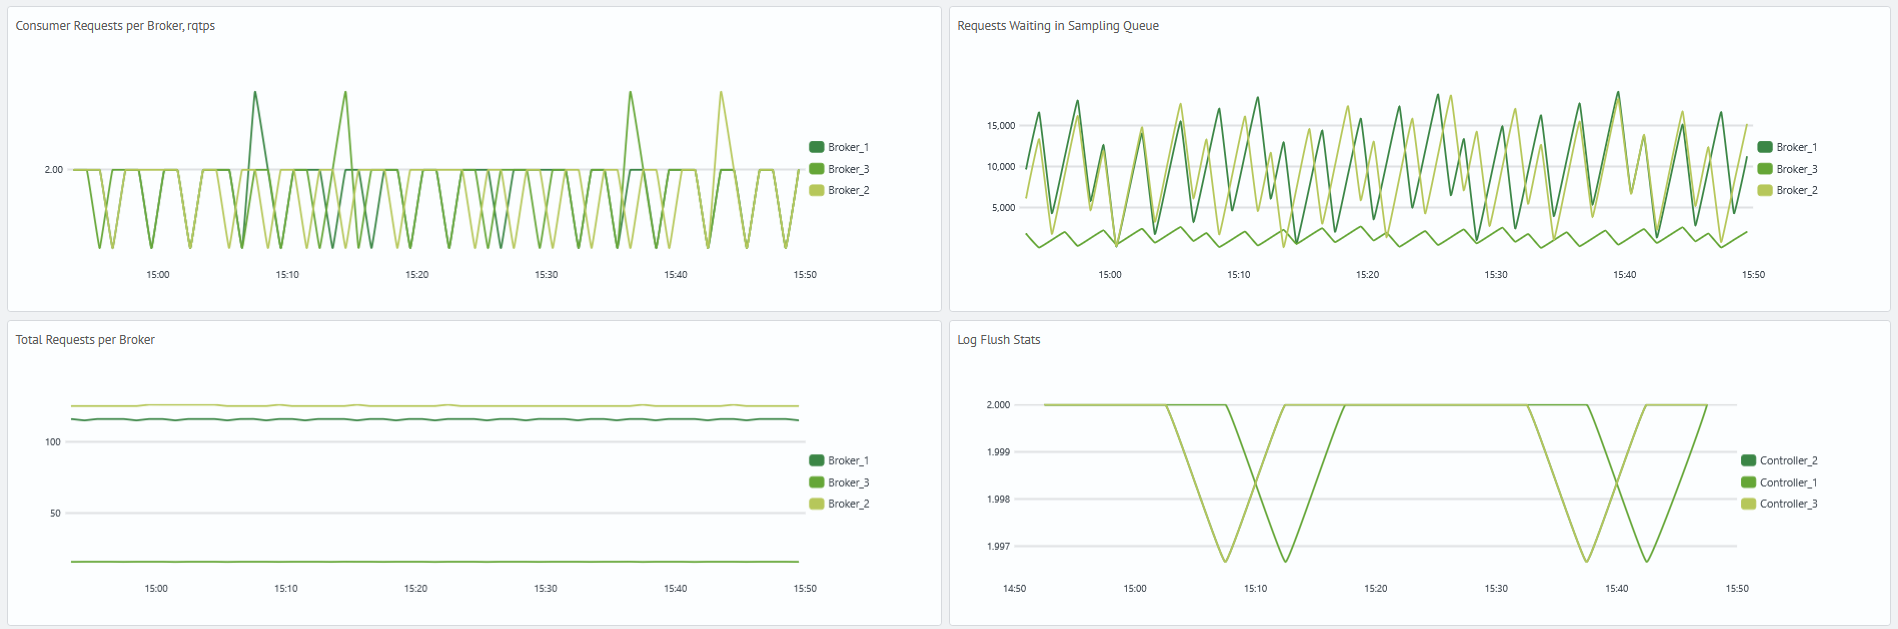
- overall request rates for every broker per second
- consumer request rates per every broker per second
- controller request rates per every broker per second (controller and broker-side)
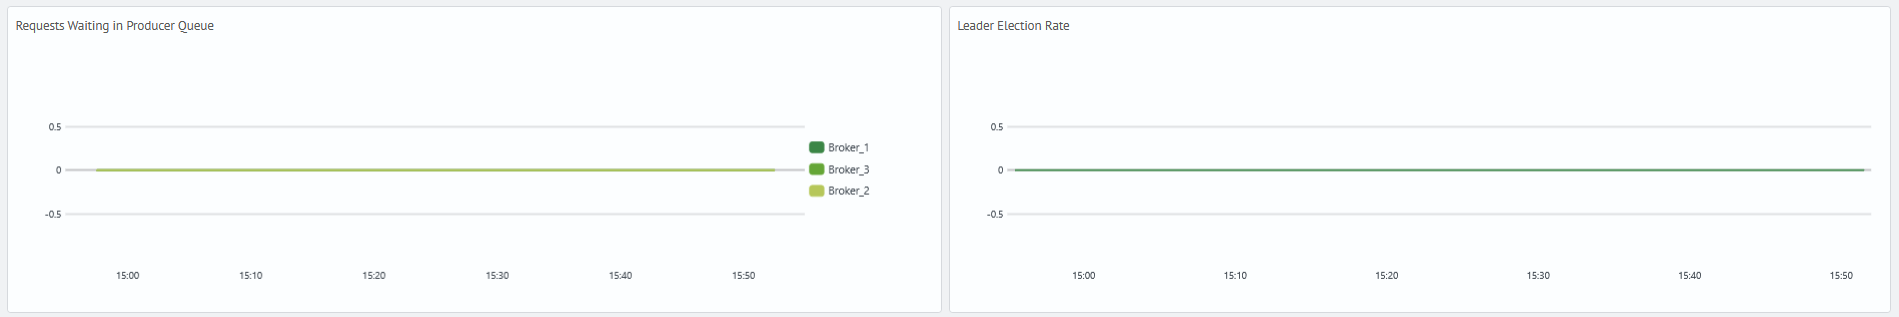
- metric charts for operations in queue
- sampling requests waiting in queue
- producer requests waiting in queue
- shrink and expansion rates of in-sync replicas per second
- general metric charts
- rate and time of log flush operations in ms
- leader election rates on the cluster
Dashboard List
- Failed Requests from Producers per Broker, rqtps
- Failed Sampling Requests per Broker, rqtps
- Total Requests per Broker
- Consumer Requests per Broker, rqtps
- Follower Requests per Broker, rqtps (Broker Side)
- Follower Requests per Broker, rqtps (Controller Side)
- Requests Waiting in Sampling Queue
- Requests Waiting in Producer Queue
- ISR Operations per Second, opps
- Log Flush Stats
- Leader Election Rate