Cluster Health
Description
The Cluster Health section of the module is intended to monitor the current state of the main parts of the cluster, as well as the message traffic.
Displayed Data
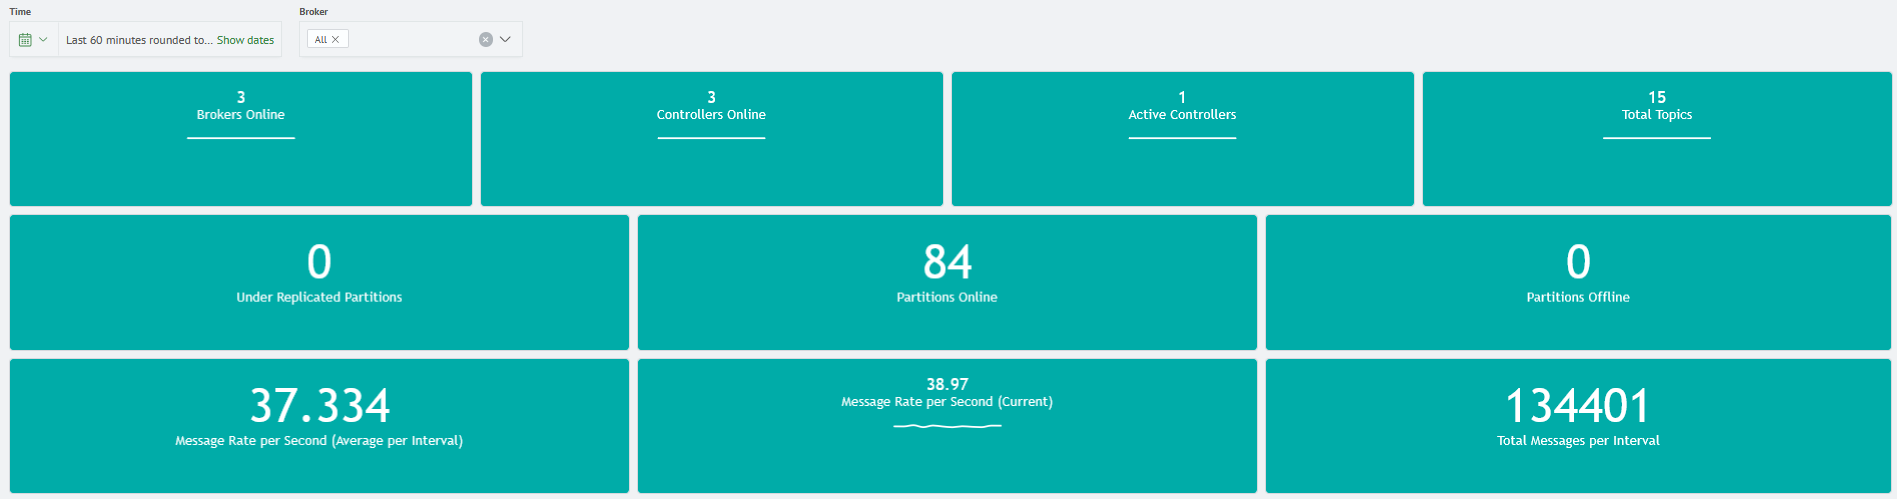
- number of working brokers and controllers on the cluster
- number of active controllers on the cluster
- number of topics on all brokers managed by the cluster
- total number of partitions on the cluster
- number of partitions without an active leader (and therefore unavailable for data reading or writing)
- number of under replicated partitions
- incoming message rate per second within a set interval
- current cluster-wide incoming message rate per second
- total message rate within a set interval
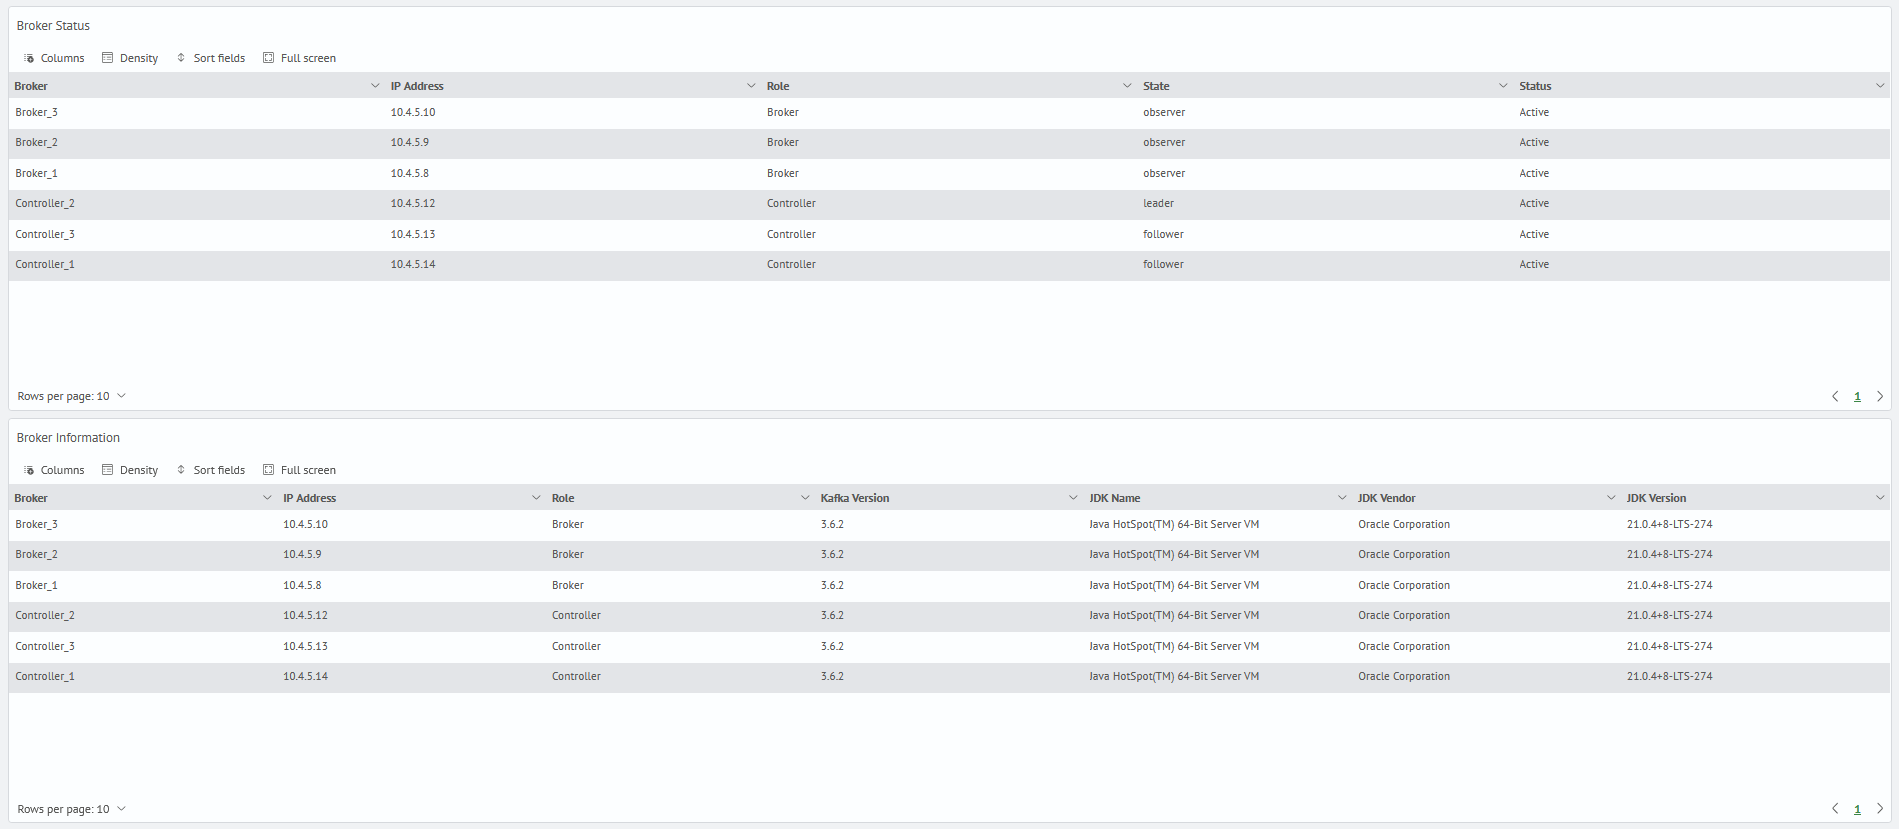
- current broker status (roles, states, activity status)
- general broker information (names, IP addresses, cluster roles, current Kafka version and JDK information)
Dashboard List
- Brokers Online
- Controllers Online
- Active Controllers
- Total Topics
- Partitions Online
- Partitions Offline
- Under Replicated Partitions
- Message Rate per Second (Average per Interval)
- Message Rate per Second (Current)
- Total Messages per Interval
- Broker Status
- Broker Information