JVM
Description
The JVM section of the module is intended to monitor JVM metrics vital for cluster functionality.
Displayed Data
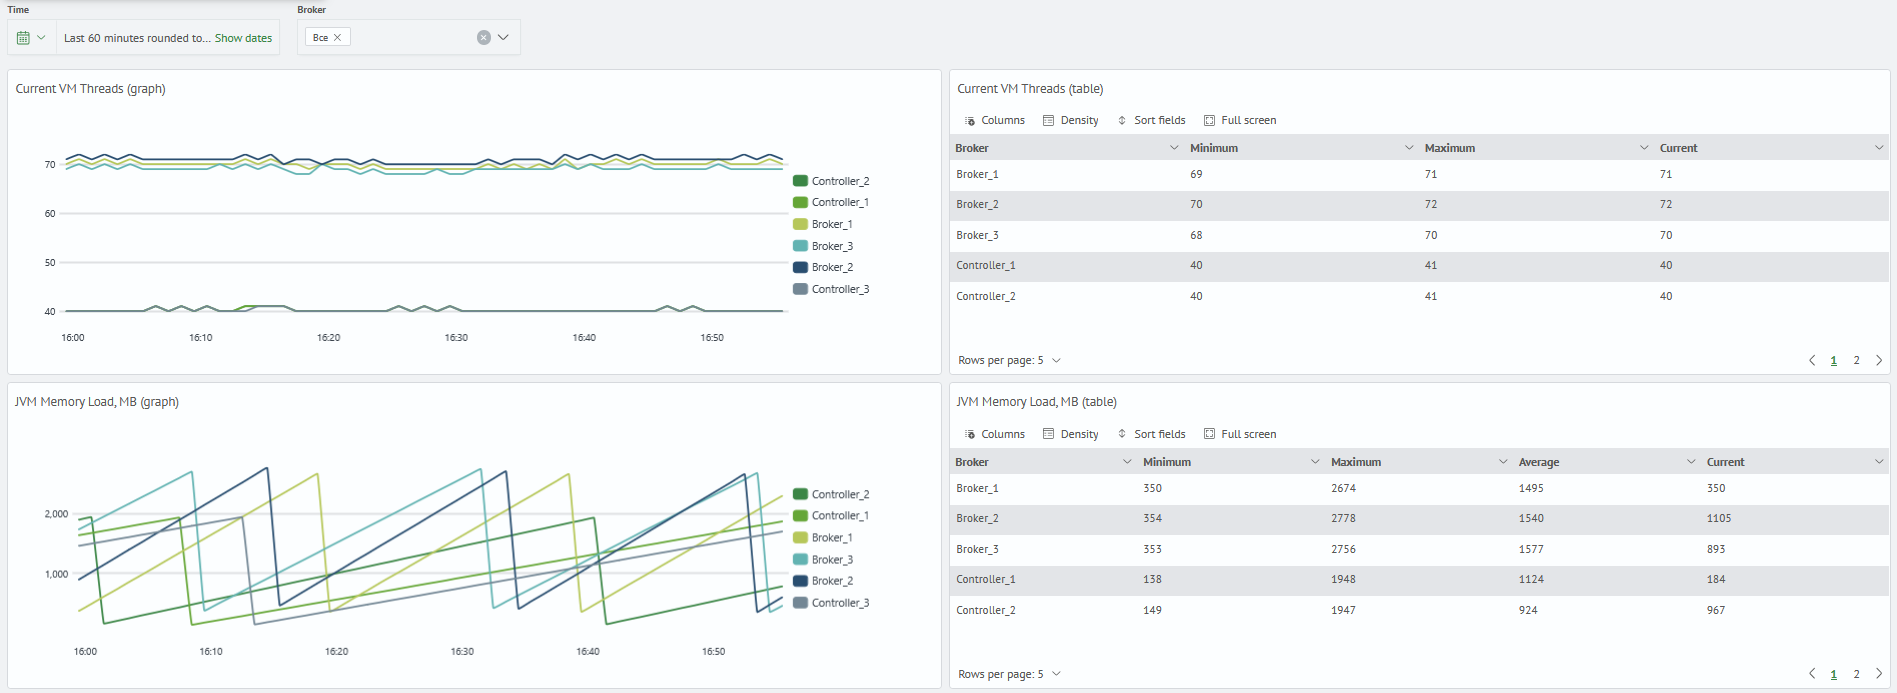
- current JVM thread size
- current JVM memory load
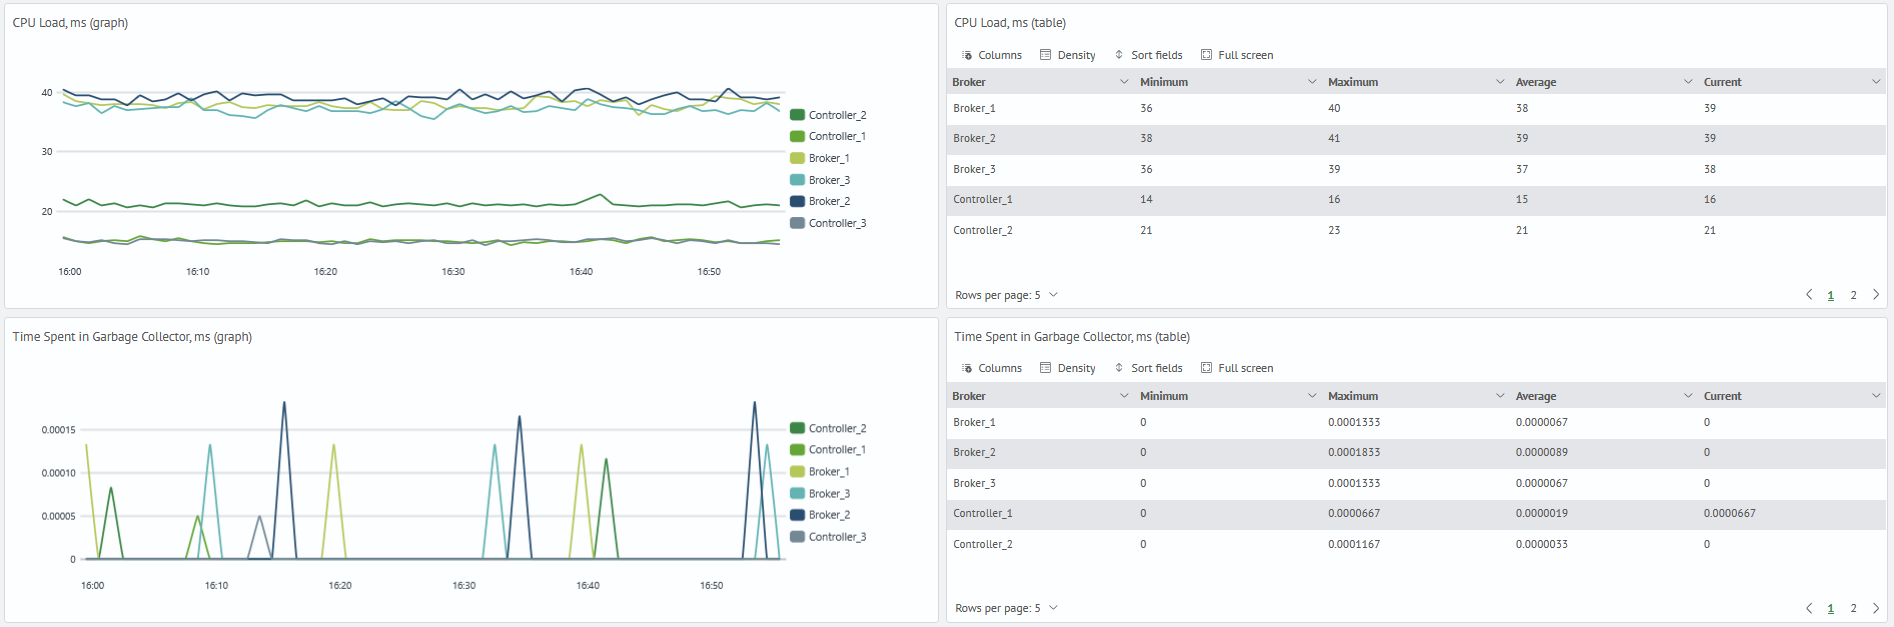
- CPU uptime (sum of user and system process handing)
- time spent in JVM garbage collector
Dashboard List
- Current VM Threads (graph)
- Current VM Threads (table)
- JVM Memory Load, MB (graph)
- JVM Memory Load, MB (table)
- CPU Load, ms (graph)
- CPU Load, ms (table)
- Time Spent in Garbage Collector, ms (graph)
- Time Spent in Garbage Collector, ms (table)