AI Observability: GPU Status
The AI Observability: GPU Status dashboard shows the status of GPUs serving inference workloads.
It tracks GPU load, memory usage, temperature, and hardware errors to identify signs of equipment degradation.
Useful for: ML infrastructure engineers, system administrators, DevOps.
Data source: gen_ai_gpu_metrics*
Main Sections
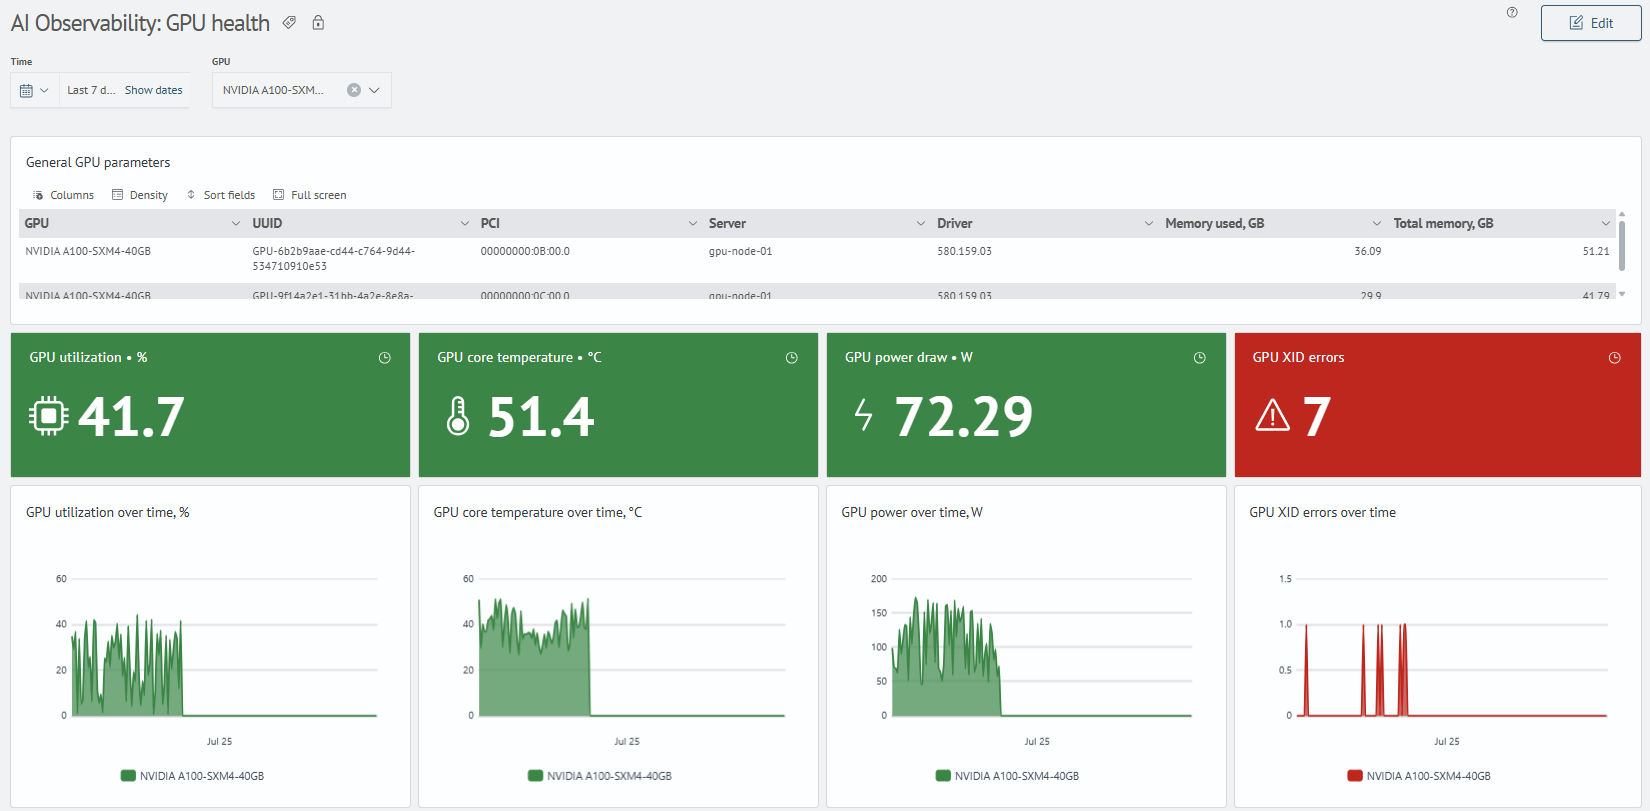
1. AI Summary and General GPU Parameters
Shows a summary of GPU status and information about each GPU:
- AI summary: overall GPU status, a brief assessment, identified issues, and recommendations
- model, UUID, PCI address, server, and driver version
- total and used GPU memory
2. GPU Status
Shows the main GPU operating metrics:
- current GPU load
- core temperature and power consumption
- presence of XID errors
- load, temperature, power, and error trends over time
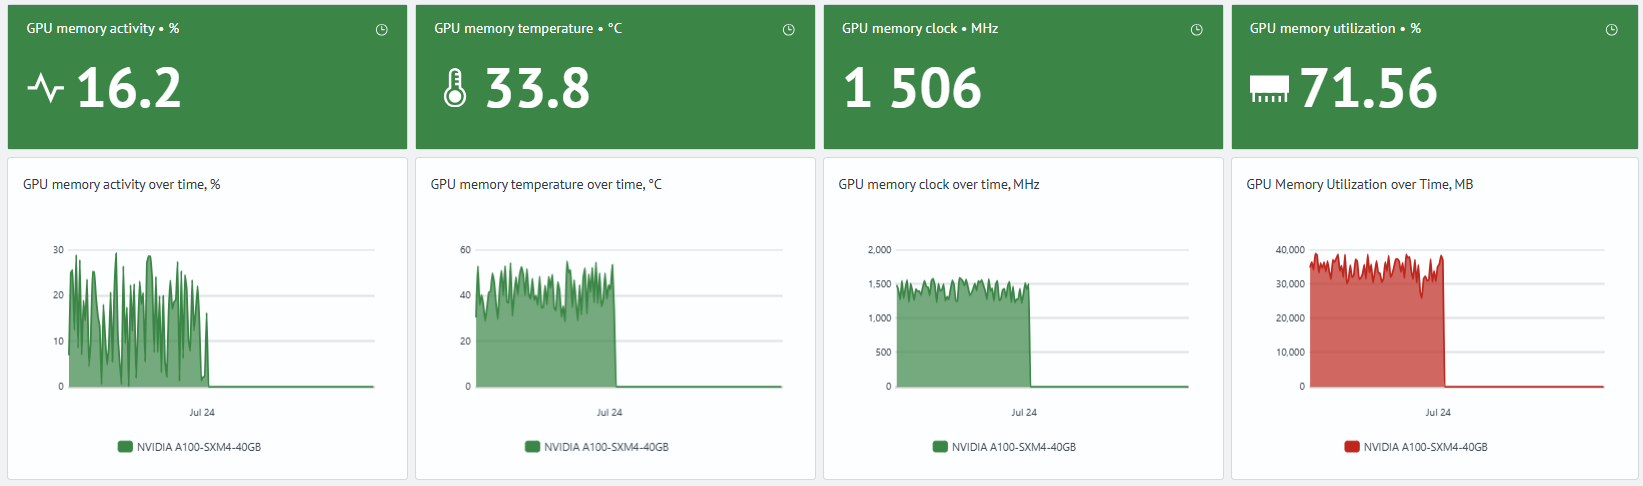
3. GPU Memory
Shows the status and dynamics of GPU memory usage:
- GPU memory activity
- GPU memory temperature
- GPU memory frequency
- GPU memory utilization
- memory metric trends over time