Trace Details Dashboard
The APM: Trace Details dashboard is designed for analyzing a specific trace selected from the main list. It provides detailed information about operations, participating services, call durations, and interaction structure.
Dashboard Structure
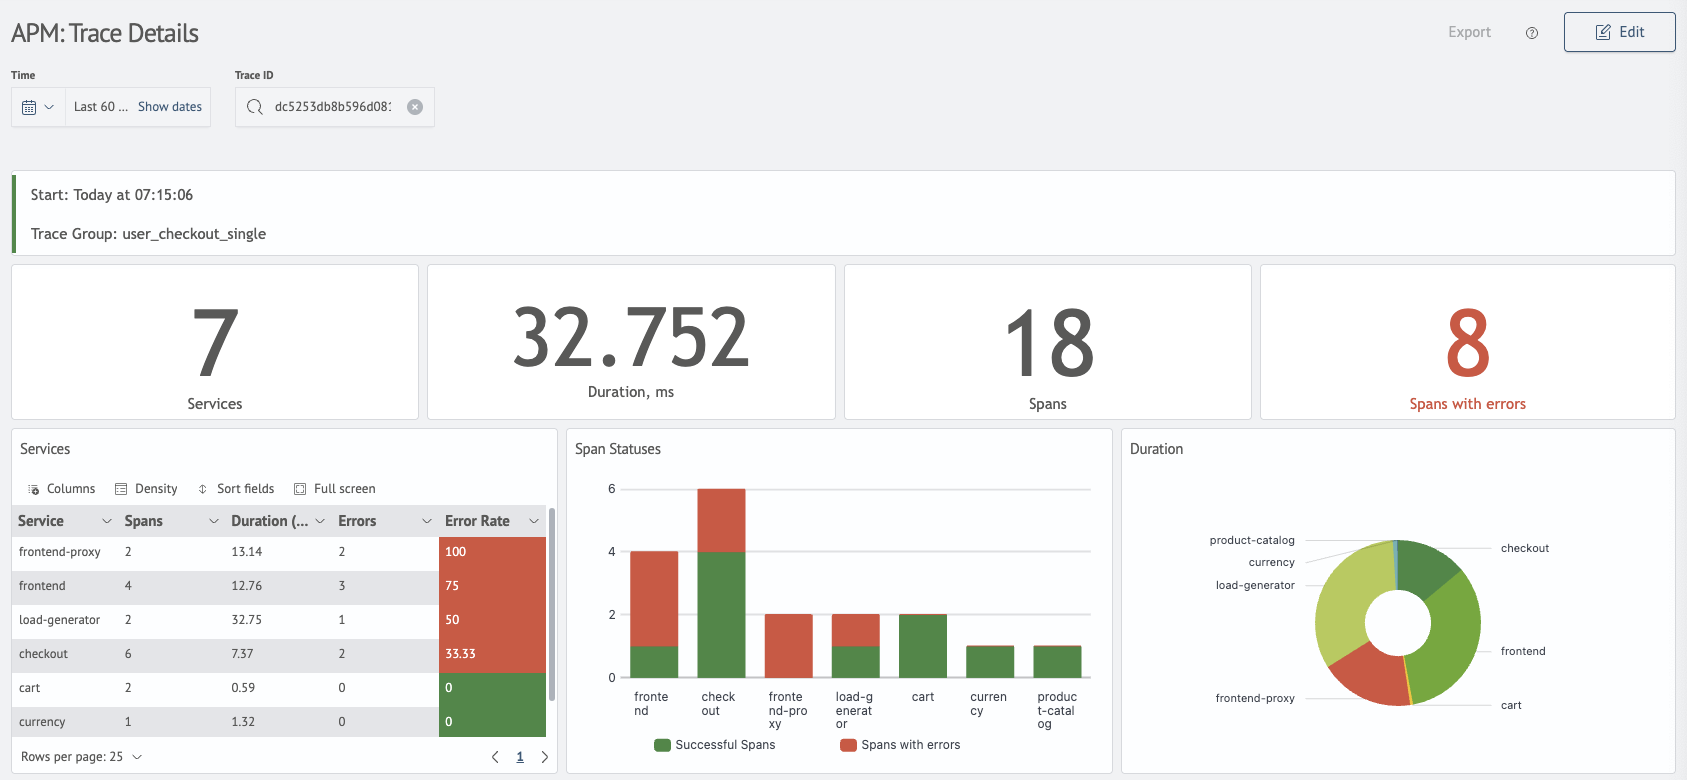
1. Trace Metrics
Displays aggregated metrics for:
- participating services
- operation execution statuses
- call durations
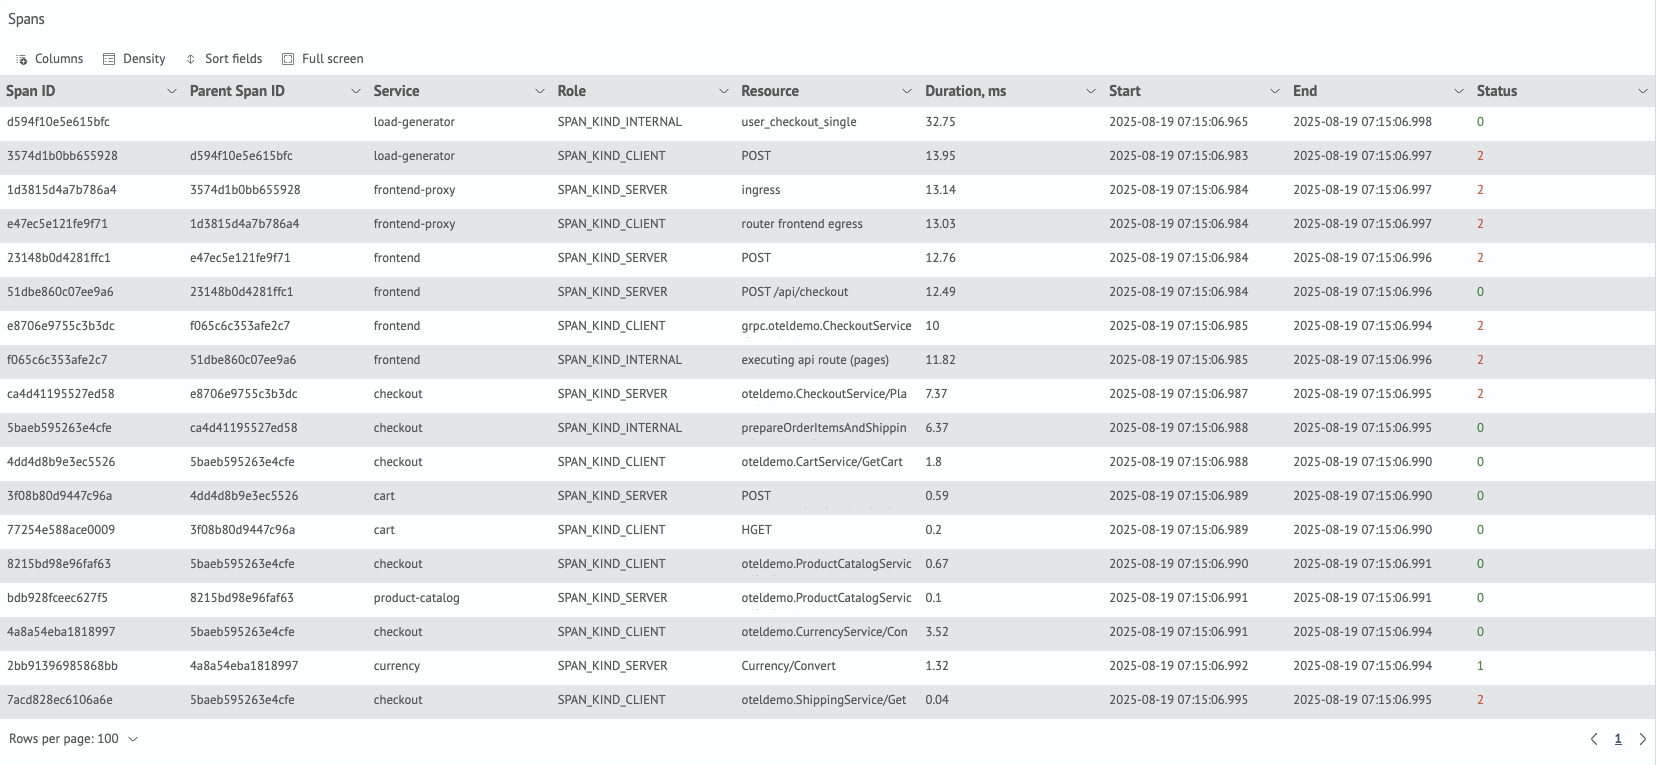
2. Operations (Spans) Table
The list of operations included in the trace. Each row contains information about the span name, status, start time, and duration.
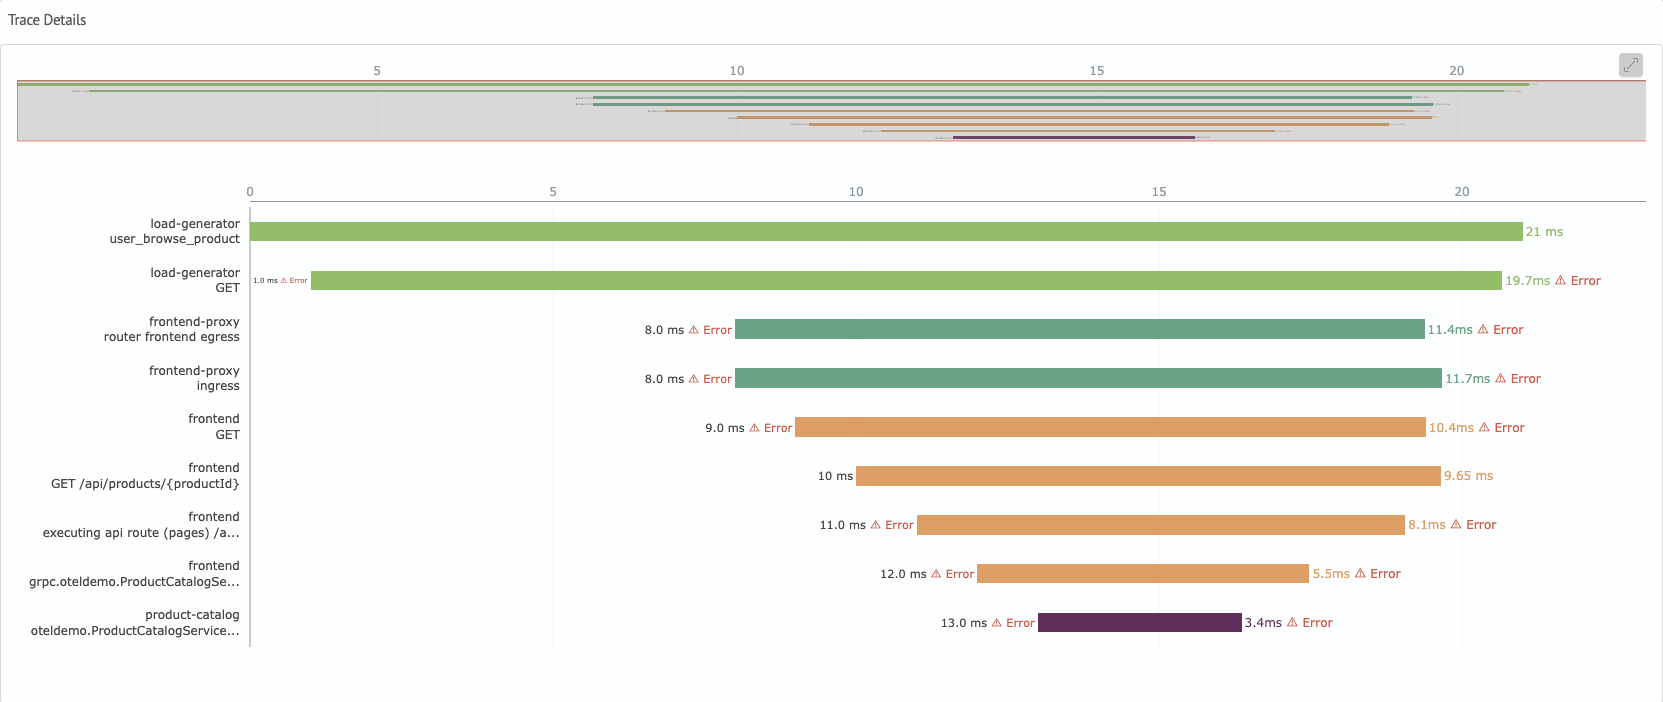
3. Call Timeline
Chronological diagram displaying the sequence of operations as a timeline.
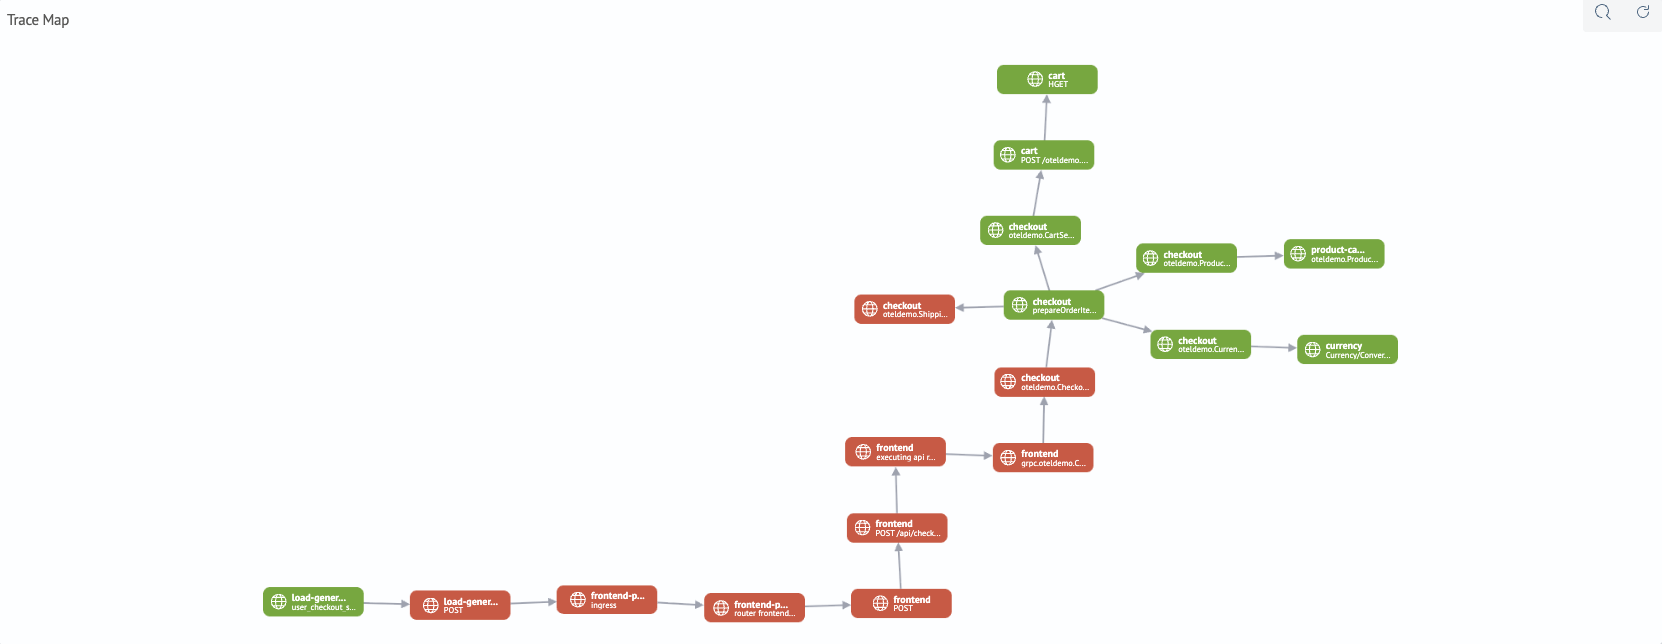
4. Call Graph
Visual representation of relationships between operations and services.
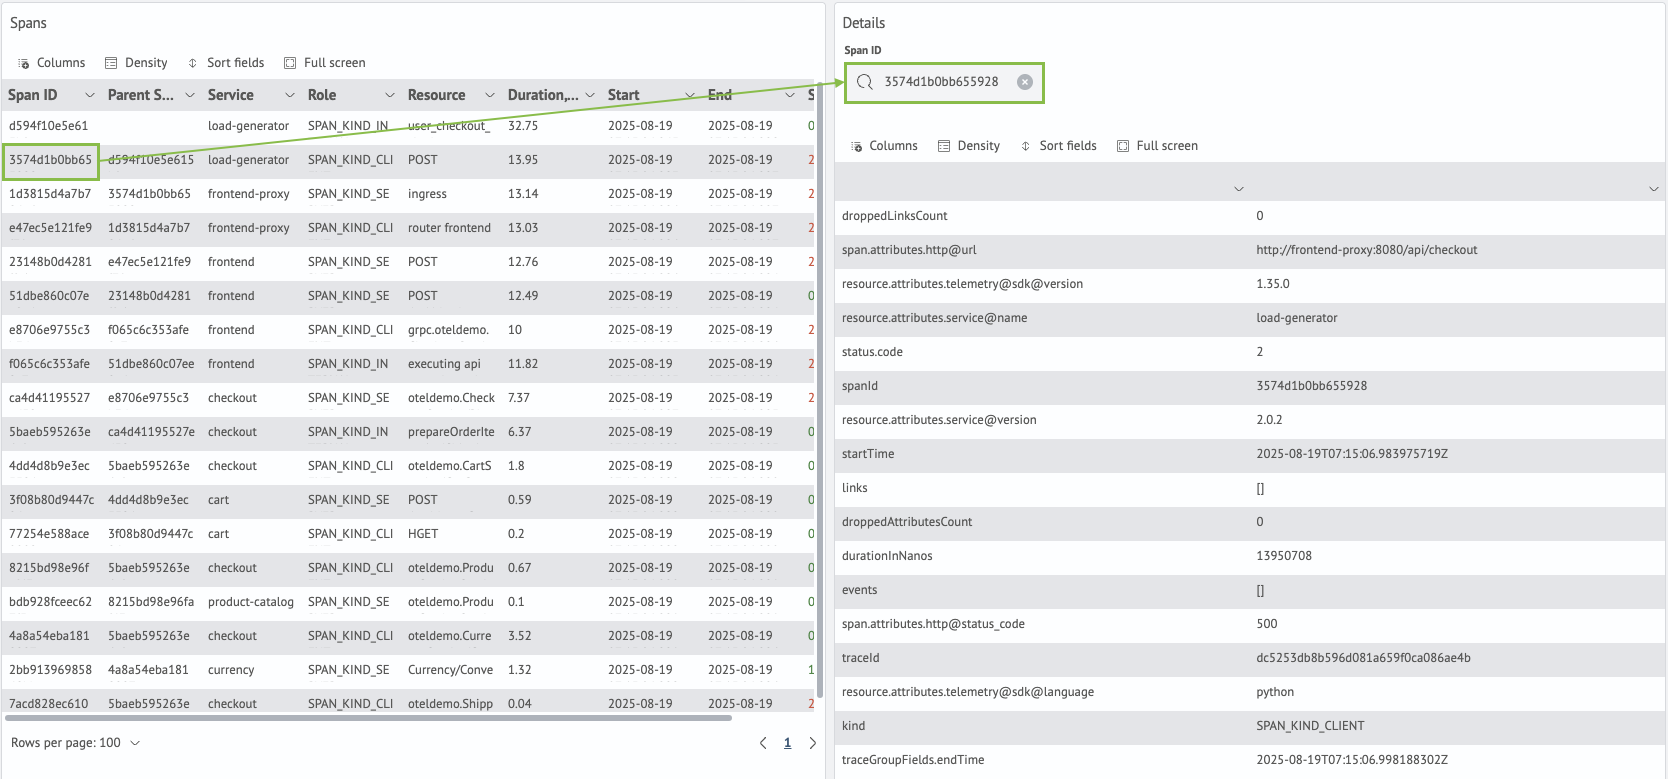
Operation Details Panel
When selecting an operation in the table or diagram, a panel appears with additional attributes:
- span ID
- name and source
- status, timestamps, tags