Traces Dashboard
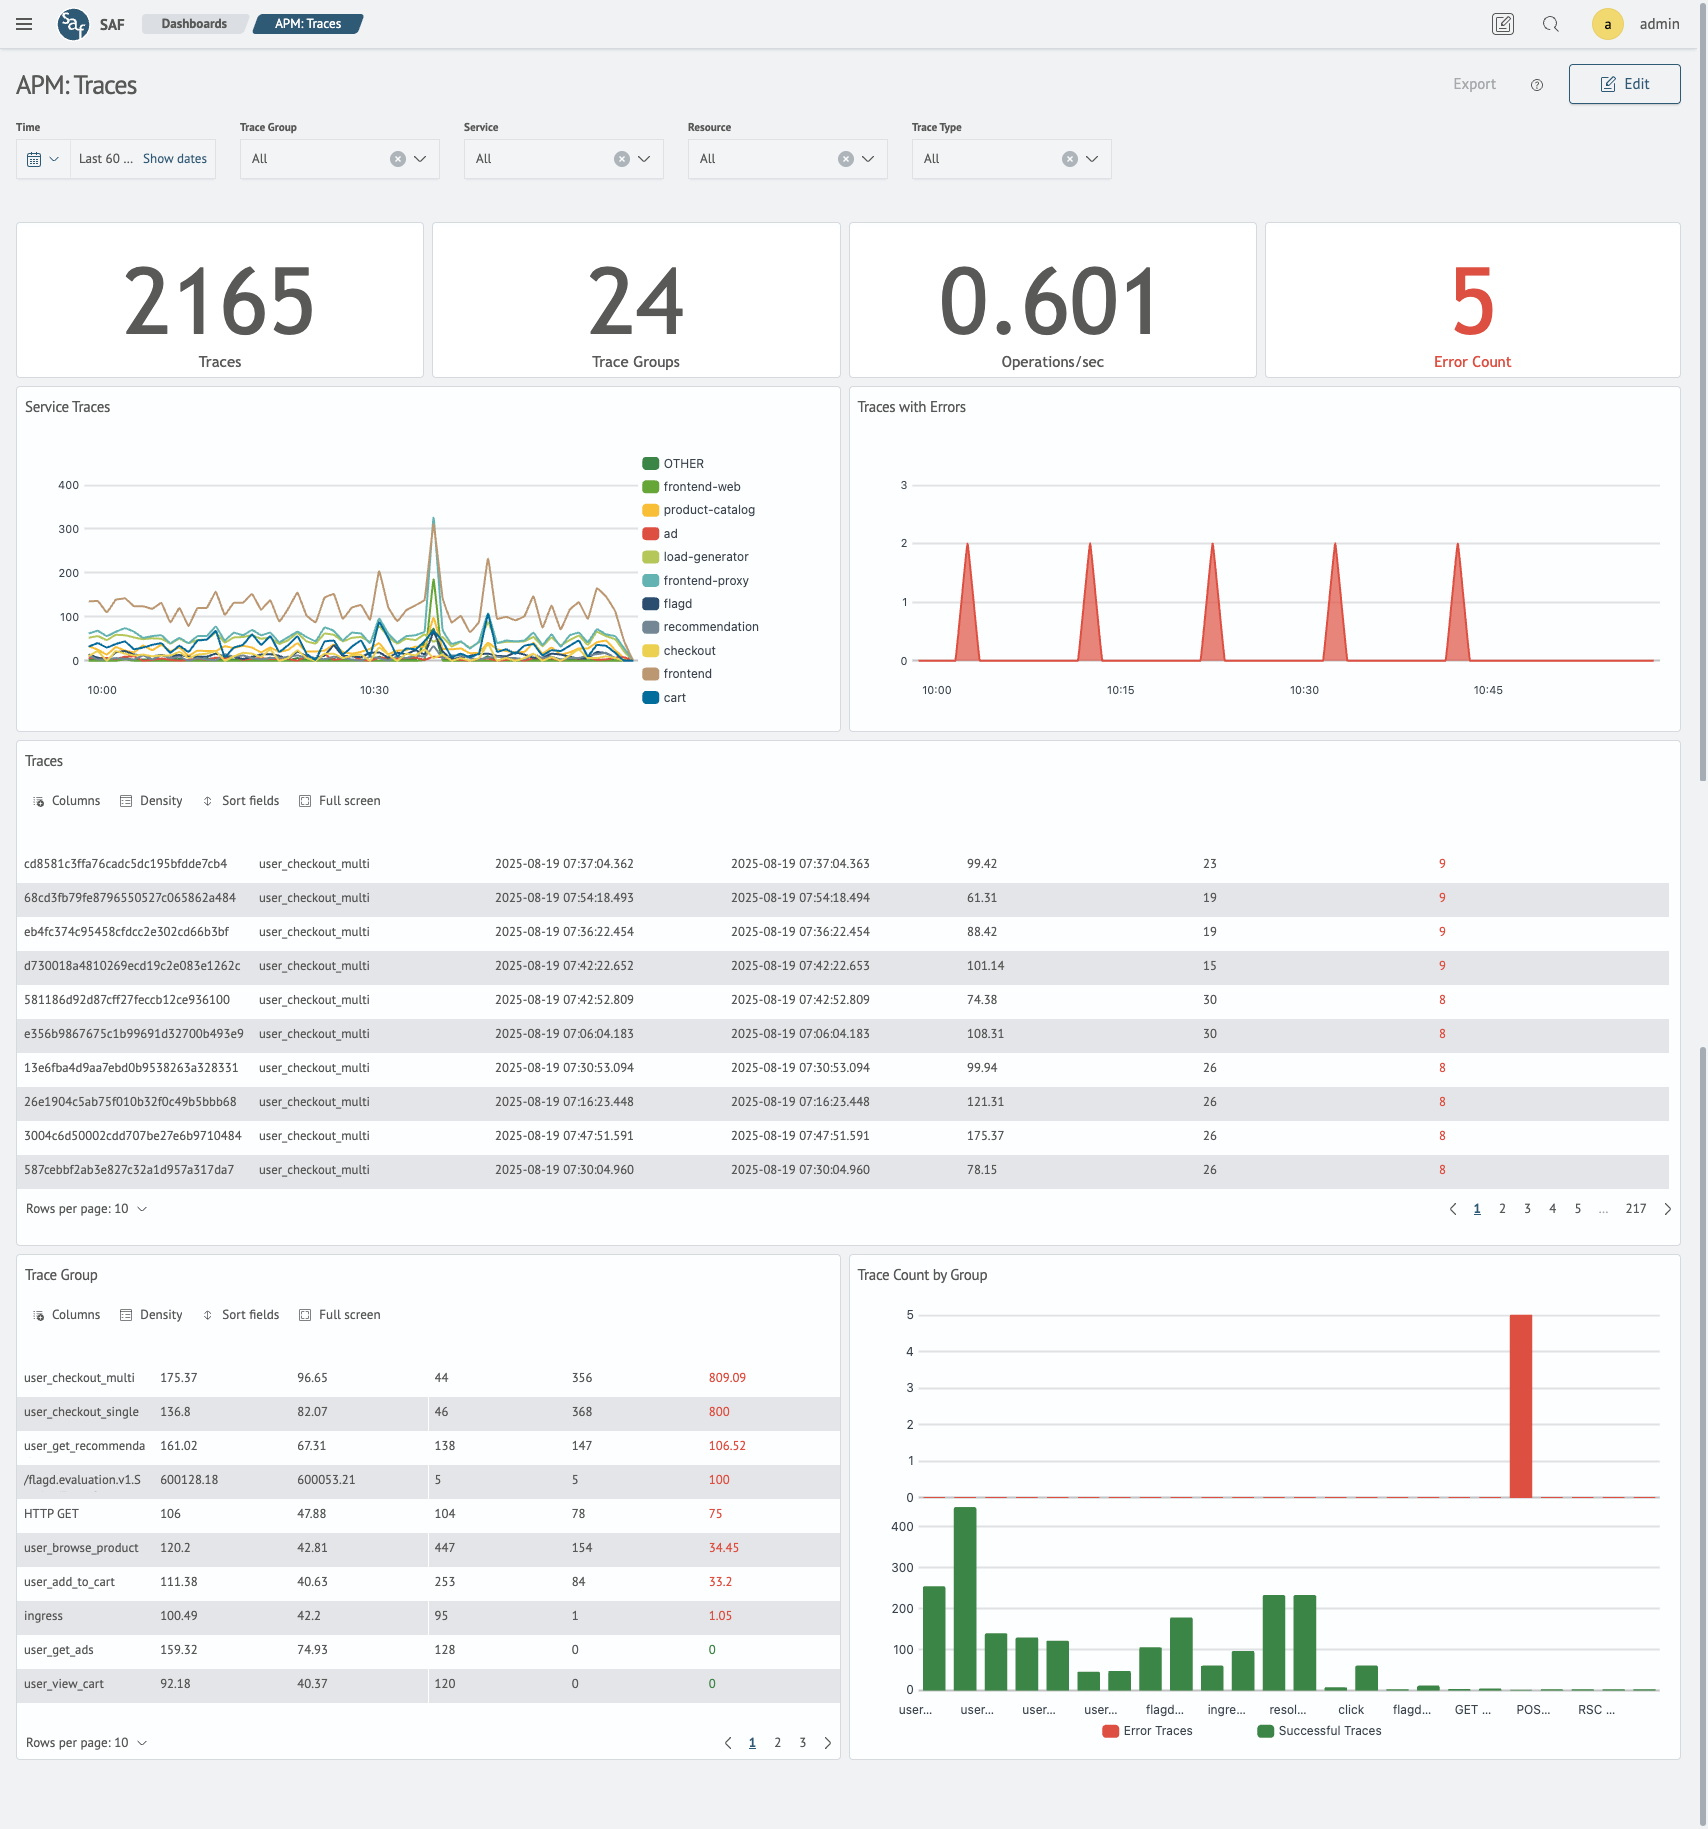
The APM: Traces dashboard serves as the main entry point to the module and is designed for initial analysis of incoming traces. It displays aggregated metrics, a trace list, and summary statistics.
Key Elements
-
Metrics:
- total trace count
- error count
- total operations (spans)
-
Trace List:
- detailed table with identifiers, duration, and status
-
Group Statistics:
- summary metrics by trace types or sources
Navigation
When selecting a trace row, users are directed to the Trace Details page for in-depth analysis of a specific request.
info
The screenshot shows the dashboard overview with metrics, table, and filtering controls.