Services Dashboard
The APM: Services dashboard is designed for analyzing the status of microservices involved in traces. It helps identify the most heavily loaded and problematic services, as well as detect behavioral anomalies.
Main Sections
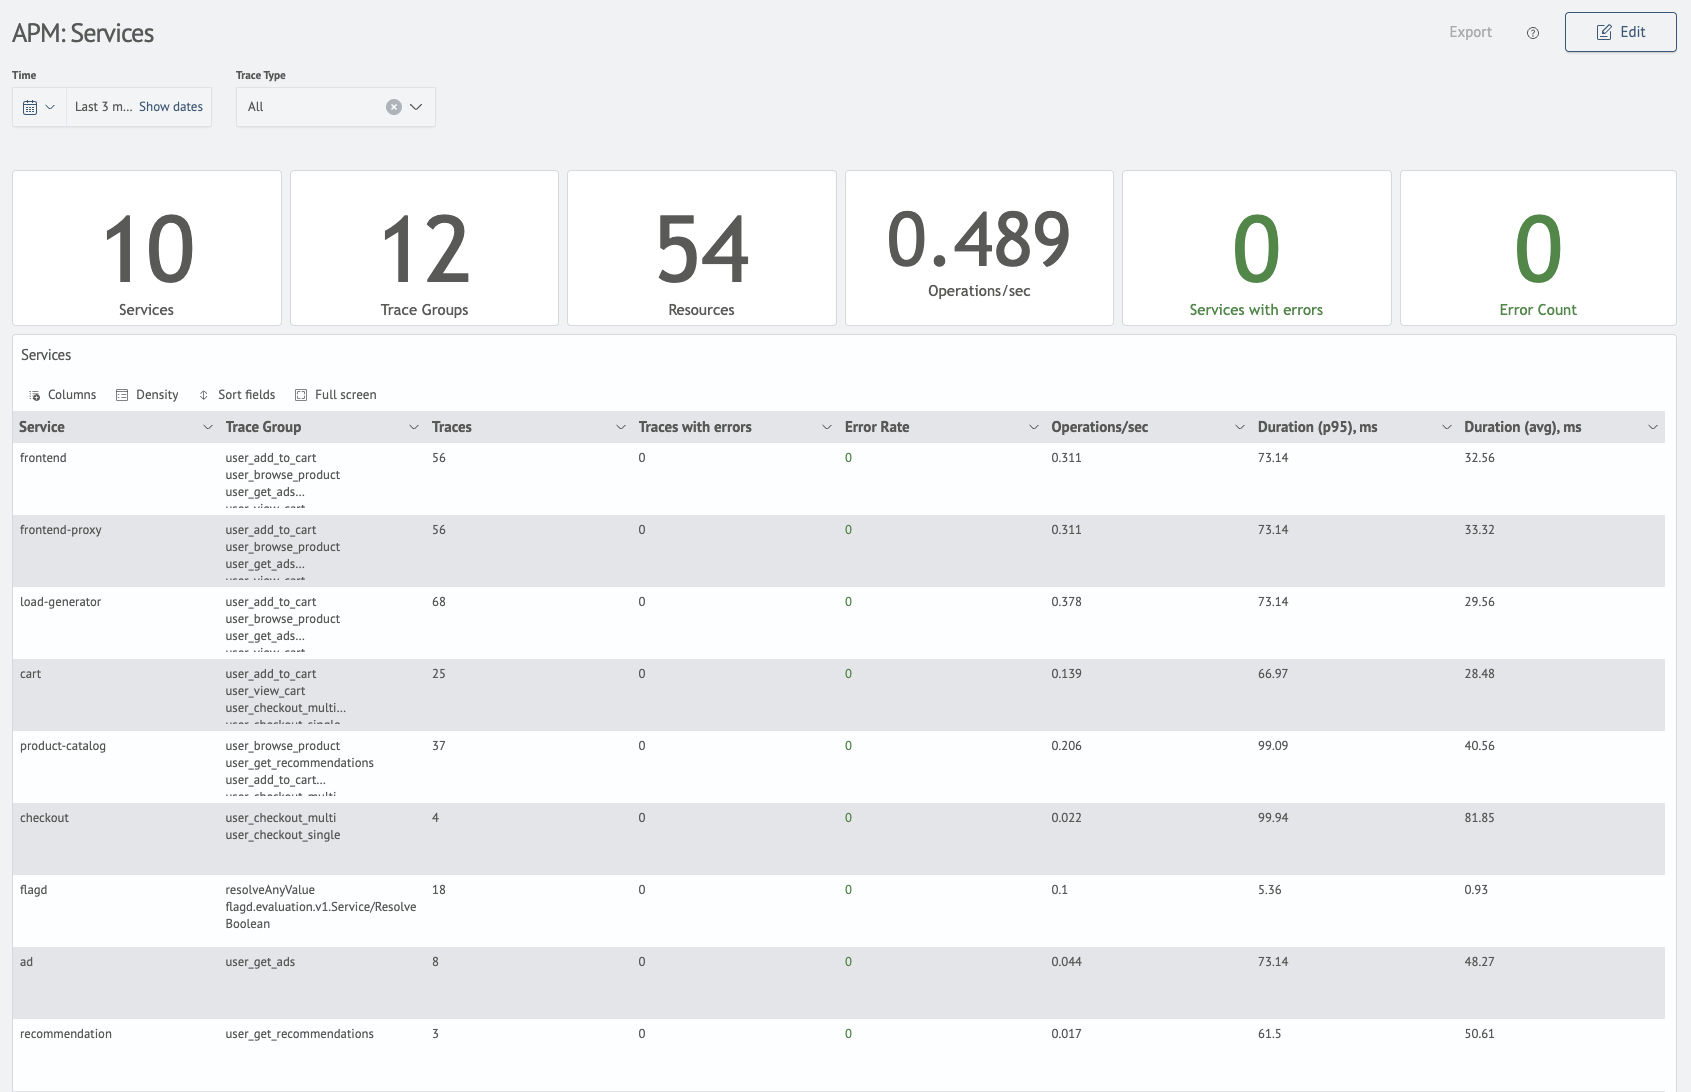
1. Service Metrics
Includes:
- total trace count
- errors and successful calls
- average execution time (latency)
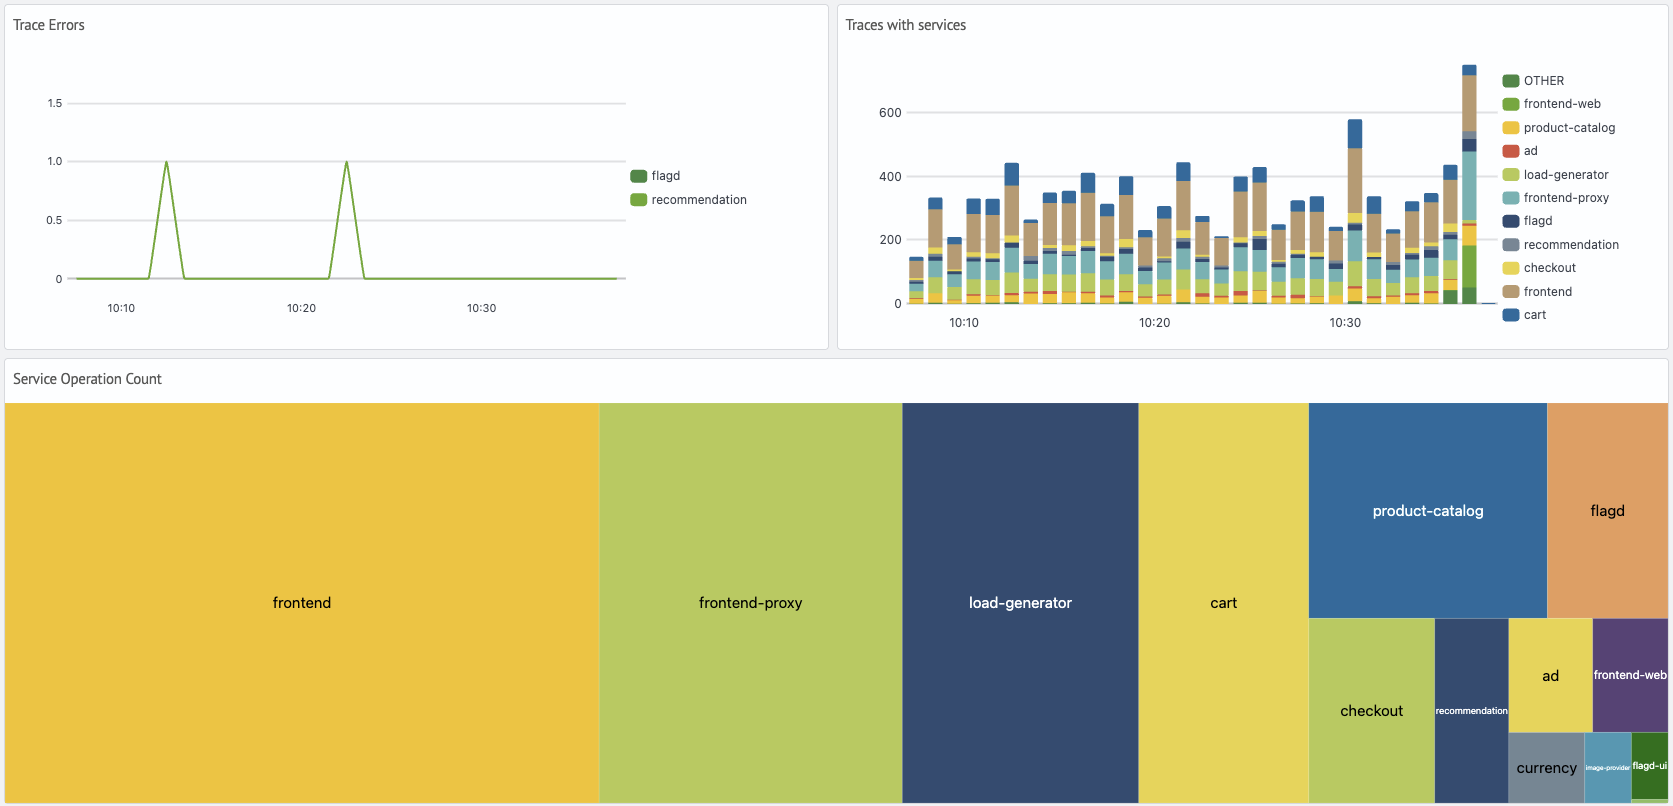
2. Distribution Charts
Display:
- trace count per service
- error distribution across services
Navigation
Selecting a row in the Services table navigates to the APM: Service dashboard, which displays spans, resources, and call structure for the selected service.