Resource Dashboard
The APM: Resource dashboard is used to analyze operations associated with a specific microservice resource. A resource can be a database, external system, message queue, or other component called from the service code.
Main Sections
1. Metrics and Charts
- average response time (latency)
- call count
- error rate by operations
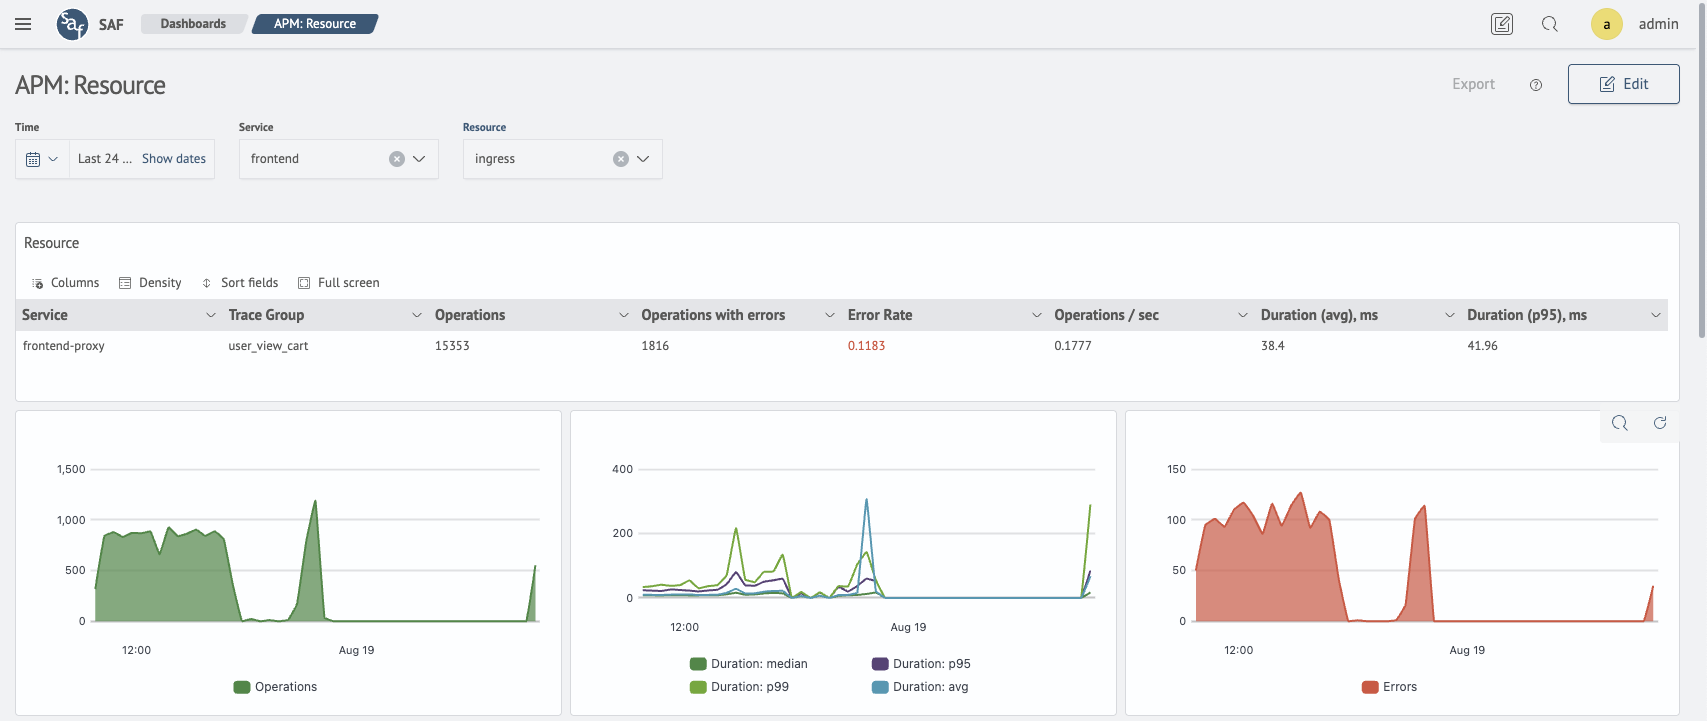
2. Operations Table
Displays all operations (spans) involving this resource:
- operation name
- status
- execution time
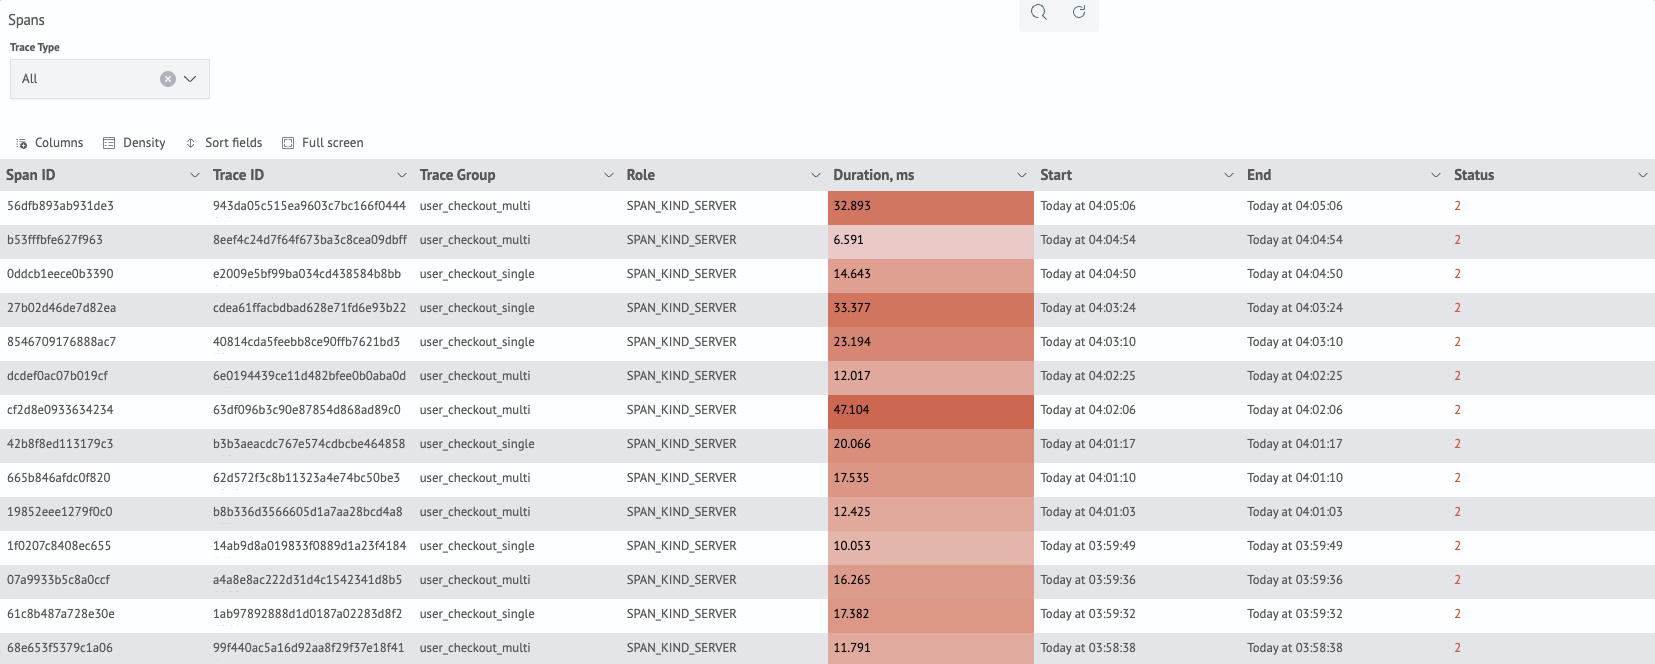
Navigation
- clicking a row in the Spans table opens the
Detailspanel containing operation attributes (similar to the Trace Detail dashboard) - clicking a row in the Details table navigates to the Trace Detail dashboard with focus on the selected span