Search
Overview
The Search component is designed to work with search queries and the results of their execution.
To navigate to the component section, you need to open the Main Menu - Search item in the Main Menu.
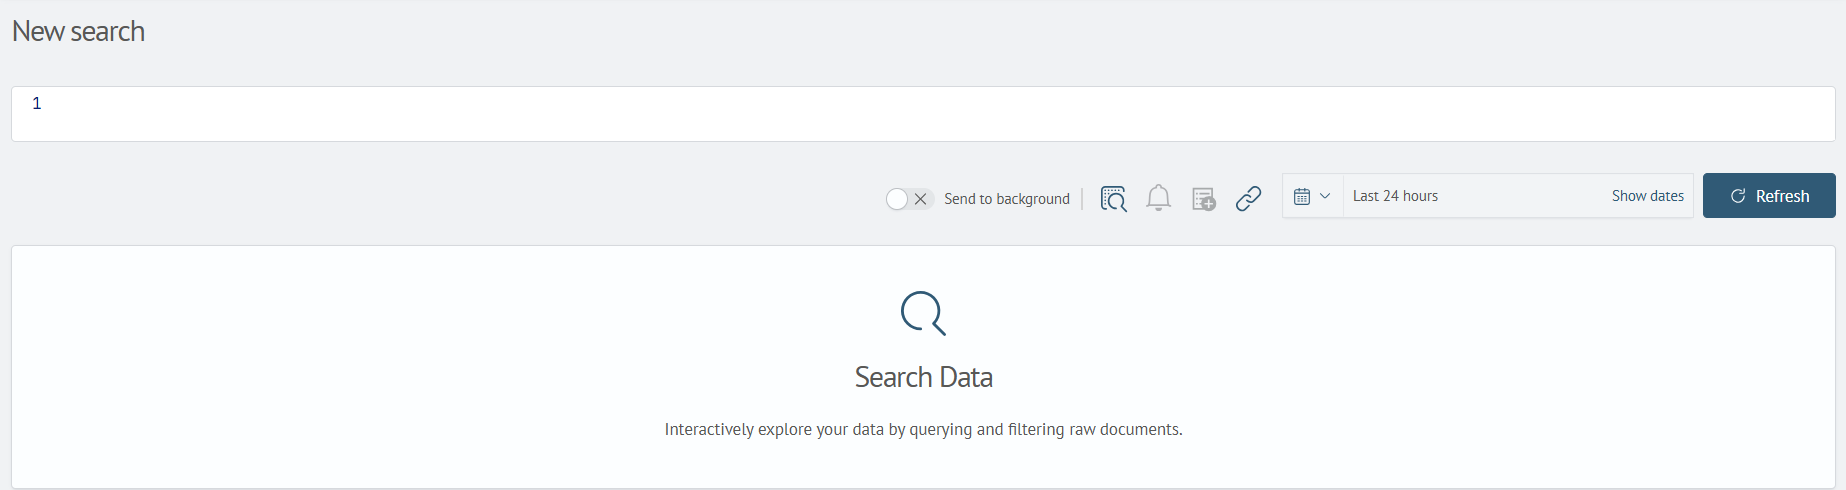
At the top of the page, there are input fields for the search query and specifying the time interval. To execute a search on the data, you need to formulate a query in the Search Anywhere Framework Language (SAFL), specify the desired time interval, and click the Update button.
Data Access
The simplest query involves retrieving data from the storage using the source command and specifying the data source's name.
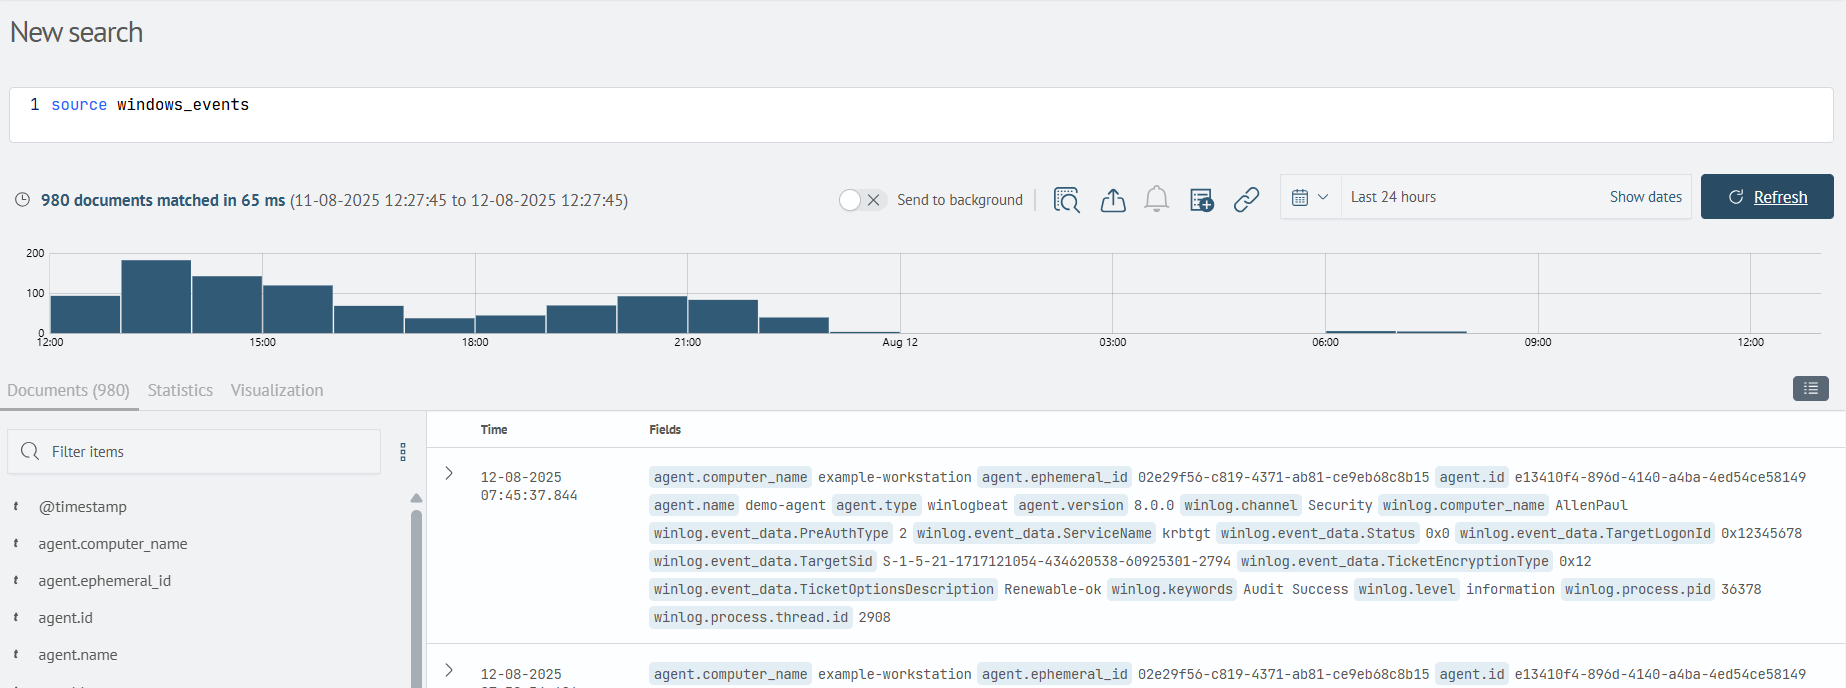
After executing such a search query, the page will display a histogram showing the distribution of events over time, a list of the events themselves, each of which can be expanded to examine field values, and a side panel containing a list of all source fields, allowing for statics based on their values.
This format of data access is convenient when it's necessary to get an overview of the data source. However, in most cases of data handling, the need arises to form a certain sample, apply filtering, plot a time-based graph, compute a metric, and so on. All these operations are implemented using the SAFL query language.
Data Filtering
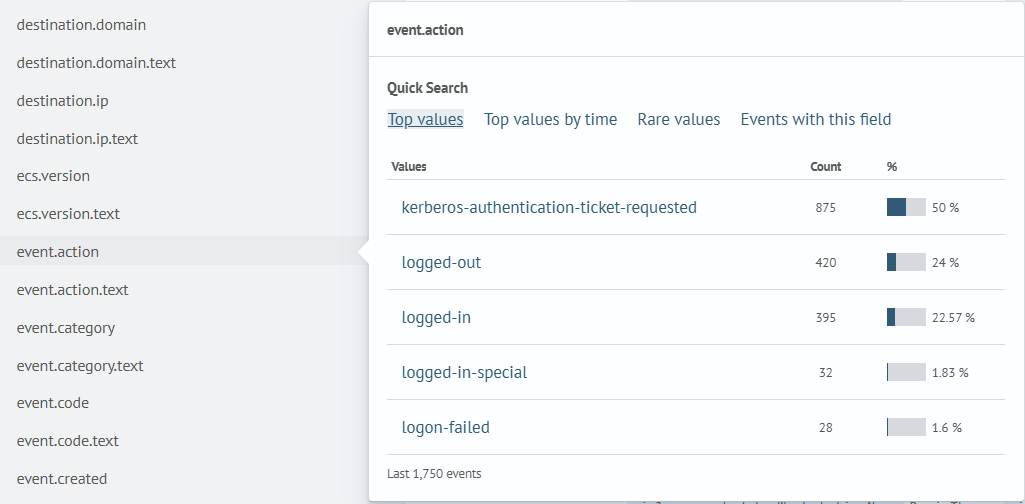
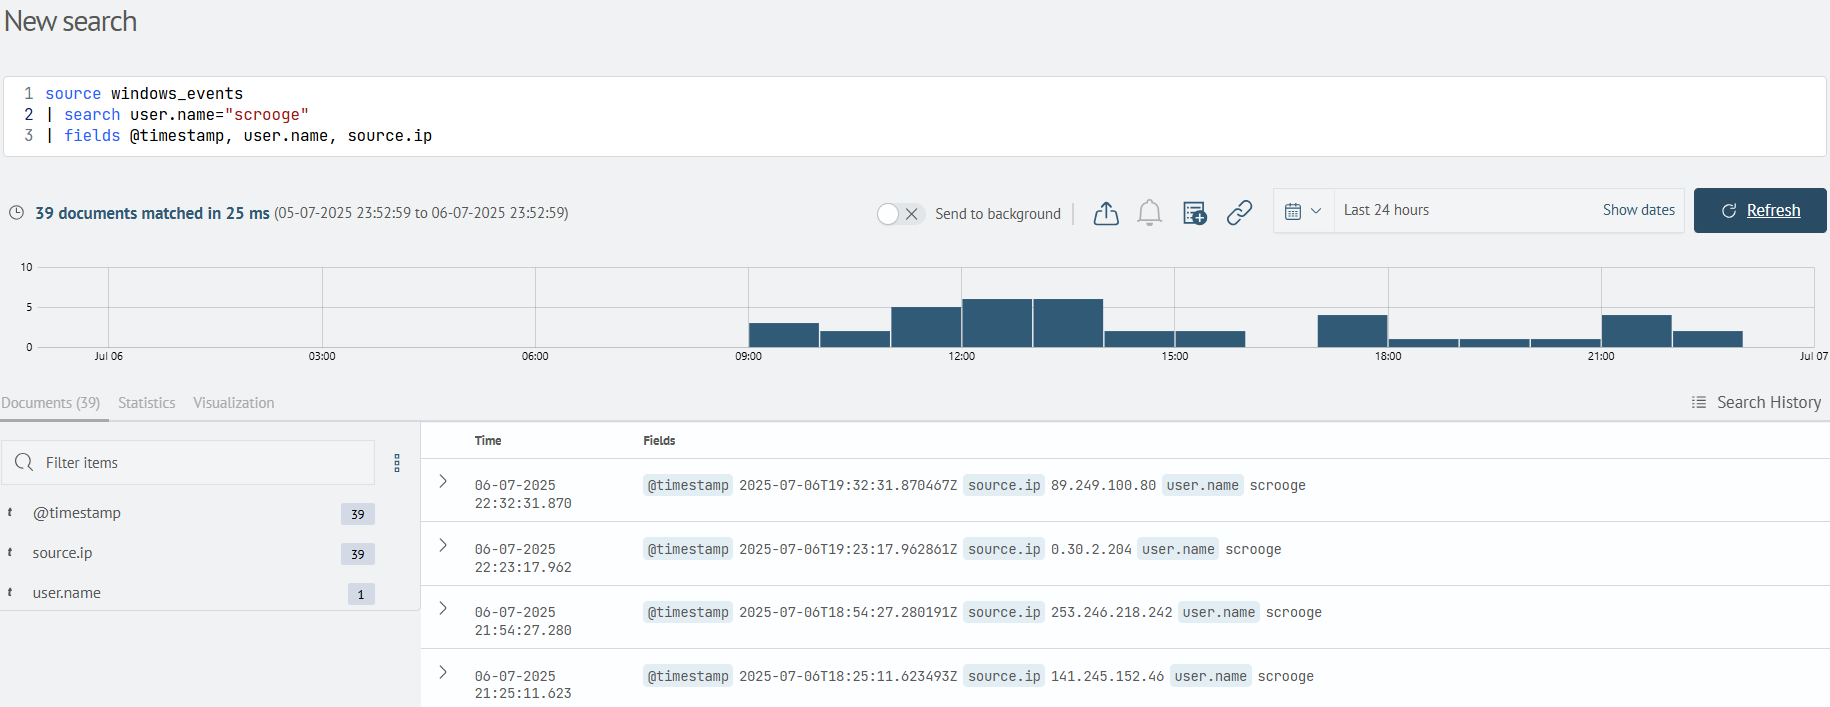
The search command is designed for performing initial event filtering. The command supports logical expressions, pattern matching using the * symbol, and various types of comparisons. The fields command is used to include or exclude fields displayed in each event.
Statical Calculation
Statistical calculation is implemented using the aggs command. When using this command, you need to specify the aggregation function. The aggregation function can be applied either to the entire event, such as count, or to a specific field, for example, when using latest. Additionally, a grouping parameter can be specified using the keyword by.
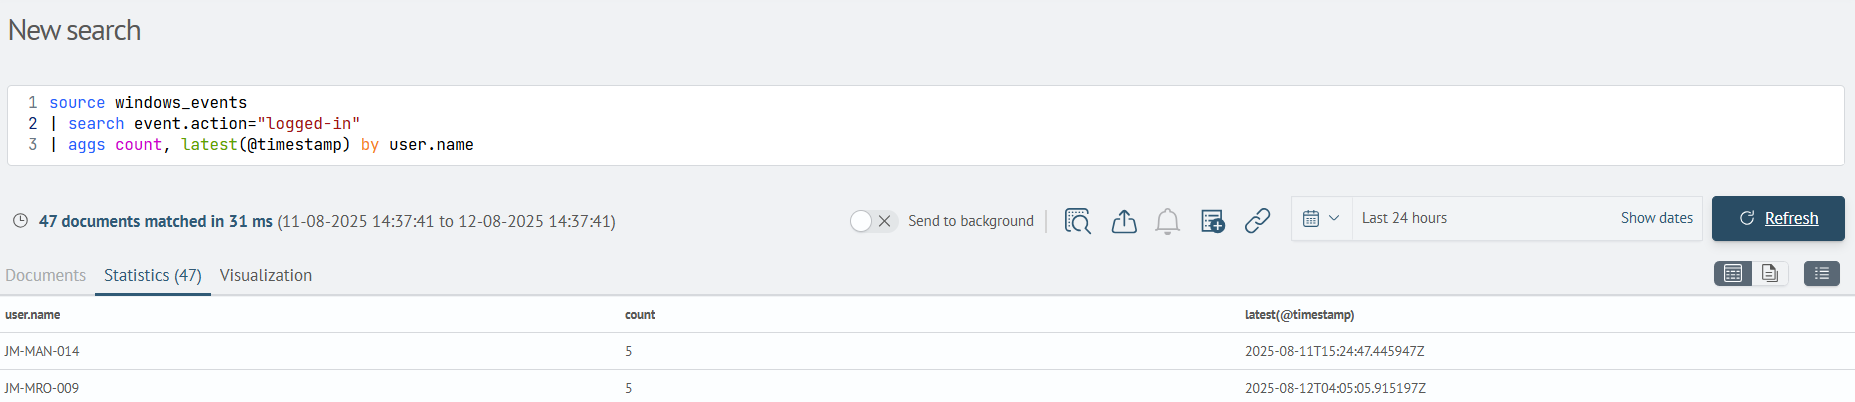
In the example shown above, the calculation of the number of logins and the date of the last login for each user over a two-week period is performed. Please note that the field composition in the results is now defined by the aggs command.
Data Transformation
When necessary, data can be modified and transformed into other formats using the eval command. This command allows you to create a new field in events, the value of which will be the result of evaluating the expression after the equals sign.
Data Visualization
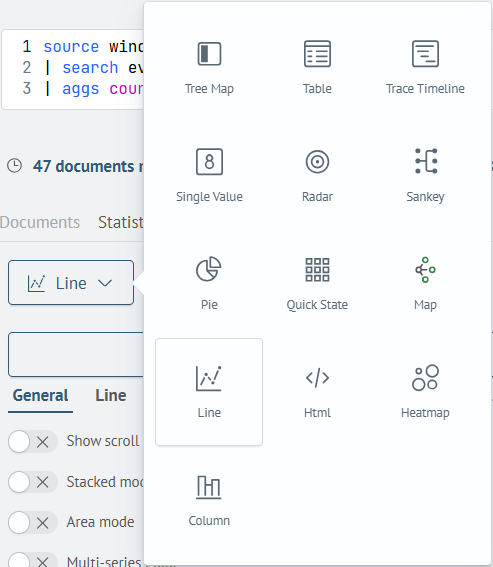
In the previous example, you may have noticed the use of the table command. The table command is one of many commands for data representation (visualization). Another way to represent data could be, for example, a time-based graph. By using the timeaggs command, you can achieve this type of visualization. This command is similar to the previously discussed aggs, with the difference that statistics are computed over a time interval specified by the span parameter.
In addition, as seen from the example, the search result will automatically be opened in the Visualization tab. This tab provides the ability to customize the visualization type and its parameters.
Data Post-processing
After initial filtering and statistical calculation, there may be a need to further filter some results. For this purpose, there is the where command.
In the example above, the first step calculates statistics on the number of operations for each type of action over the last day. The second step performs filtering, which allows excluding two types of actions that are not of interest to the user from the statistics.
The where command is somewhat similar to the search command, but it is important to understand their differences. The search command is executed at the level of the data storage engine and is therefore more optimized for working with large amounts of data. The limitation of search is that the command can only be used at the initial stage of the search query. In contrast, the where command is executed on the data after it has been extracted from the storage, which results in slower processing speed, but it can be used multiple times anywhere in the search query.
The same applies to other commands executed at the level of the data storage engine. Each of them has similar commands that can be executed at the post-processing stage: for aggs, it's stats, for timeaggs, it's timechart, and for peval (painless eval), it's the previously discussed eval.
Data Enrichment
In addition to excluding existing fields from search results, the SAF language also allows for including new fields in events. This is possible through mechanisms implemented in the join and lookup commands. In the case of join, data is enriched with the results of a subquery. In the case of lookup, data is enriched from a pre-defined directory.
To create a directory, you need to open the Lookup Manager - Create Lookup item in the Main Menu.
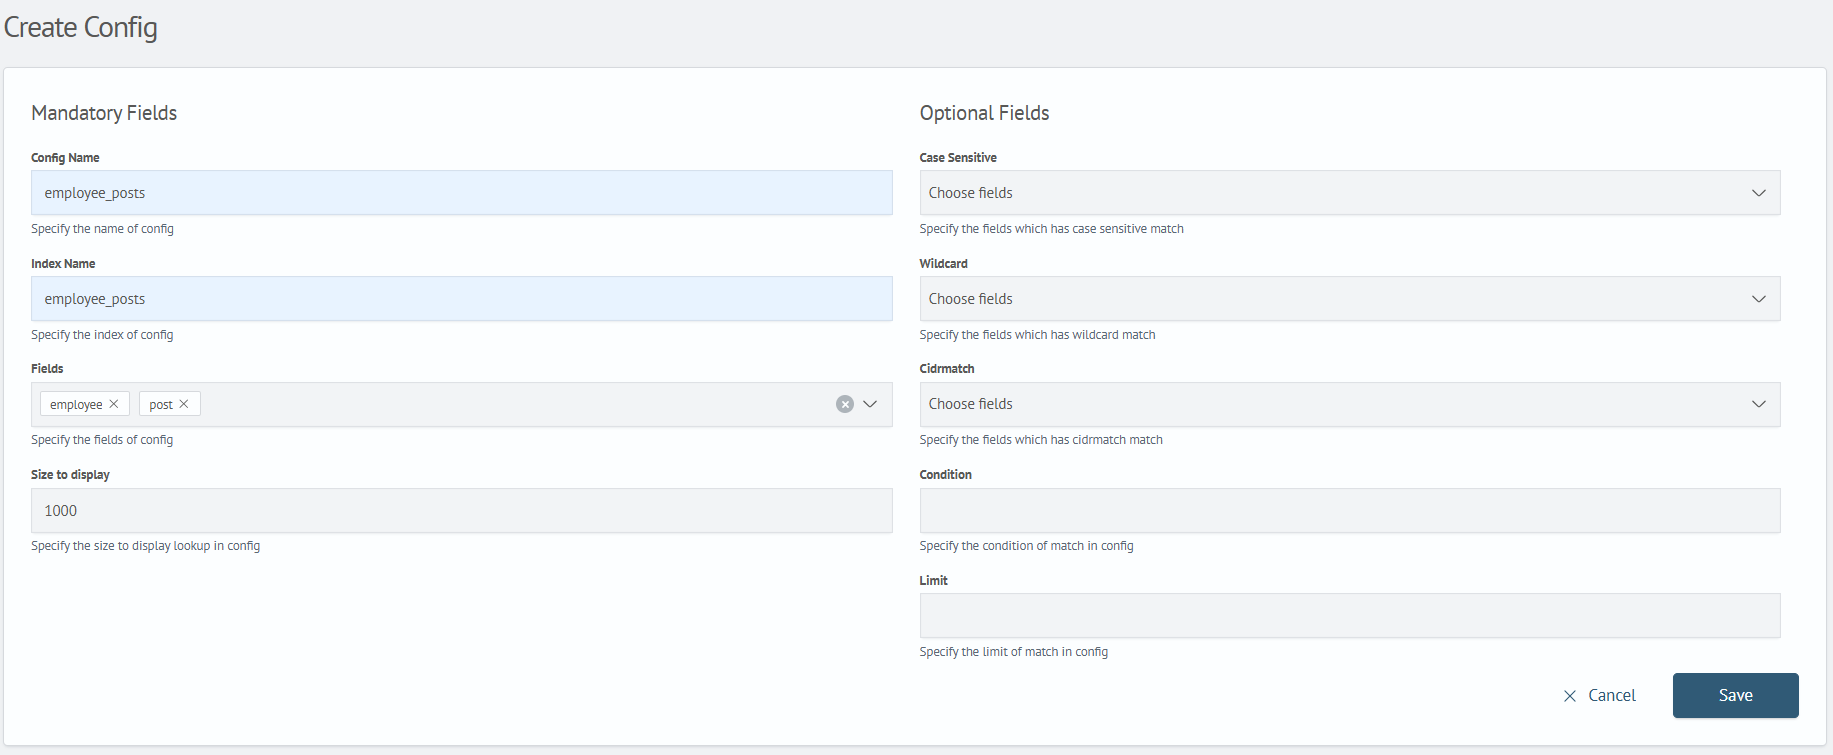
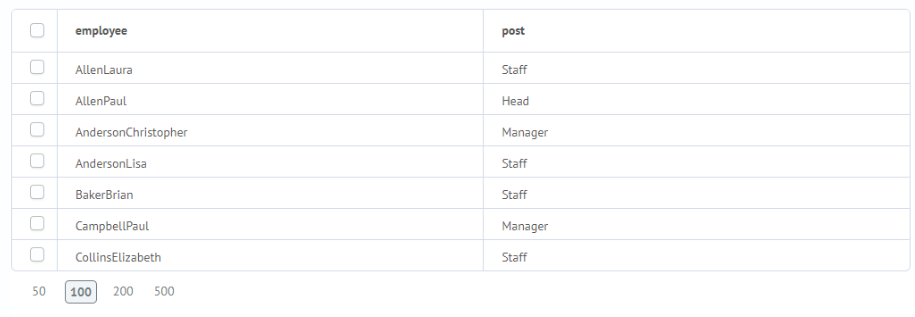
Next, you need to populate the directory with entries. This can be done manually, through file import, or using the outputlookup command.
After that, using this directory will be available in queries with the lookup command.
This article covered the basic concepts of the Search component. For a more in-depth exploration of the topic, it is available for study at search section. The list of all SAFL commands are located here.