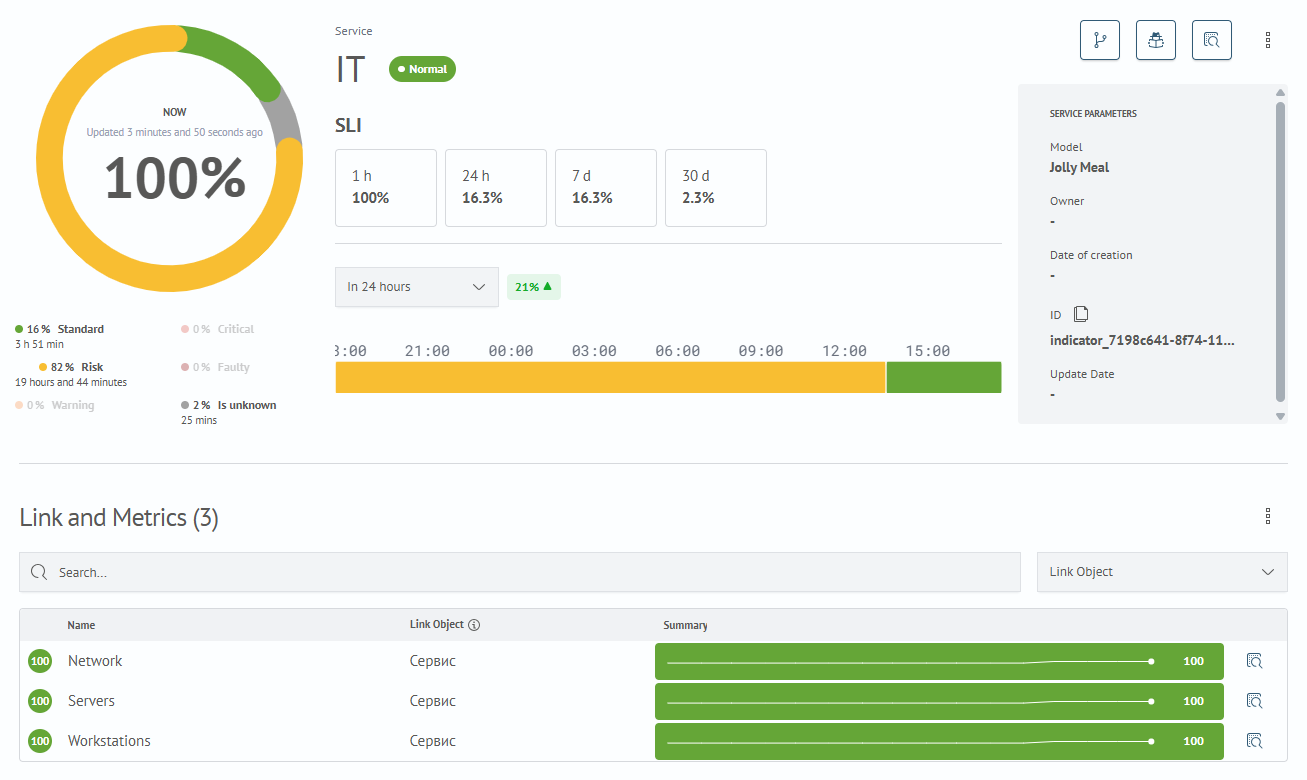
Service Details
The service details card presents data for analyzing its state and dynamics, as well as related objects (metrics and services).
On the card, the user can:
- assess the service state with current data
- analyze incidents and degradations
- go to diagnostic tools
- evaluate the impact of dependencies on service state
Card Interface
Main areas on the card:
- Service state
- Service actions
- SLI and trend
- Service state timeline
- Service parameters
- Connections and metrics
Service State
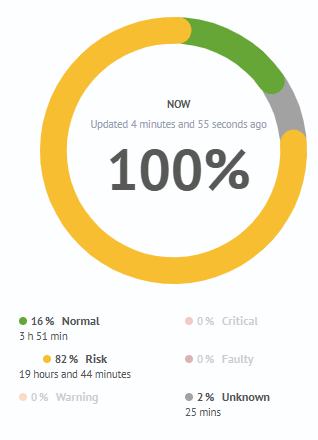
The pie chart displays the aggregated service state.
Health value - percentage value showing the overall service state for the selected time interval.
Service state is a numerical and categorical assessment of how well the service meets expectations.
State Categories
| State | Description |
|---|---|
| Unknown | Health calculation has not been performed previously or there is no data to calculate the state. |
| Normal | Service behavior meets expectations. |
| Risk | Minor deviation from expected behavior, but the monitored object still functions without impacting consumers. |
| Warning | Deviation from expected behavior requiring attention. Degradation of the monitored object affects consumers. |
| Critical | Degradation of the monitored object with maximum impact on consumers. |
| Faulty | The monitored object has completely stopped functioning. Complete functionality failure. |
Service Actions

The service card has several buttons with a set of actions.
Health Model- transition to the page with the service dependency tree for this model (see Health Model section)Root Cause Analysis- transition to the page for identifying the time and cause of service errors (see Root Cause Analysis section)Investigation- transition to the page for building a new investigation to identify service errors and problems (see Investigation section)
On the model view page, an additional service editing button appears, which contains the following actions:
Edit- transition to the service editing pageDelete- delete the service
In the service card located on the "Health Model" page, the main buttons change and another one is added.

Saved Research - transition to the page with a list of investigations, with pre-filled Model and Service filters. This button is displayed only if there are investigations for this model and service.
SLI and Trend

The SLI block displays the service availability percentage for 4 time intervals (1 hour, 24 hours, 7 days, 30 days).
The trend shows the change in service state at the end of the time interval relative to its beginning.
Time Interval
The user can select a time interval for service statistics from 5 possible options:
- 1 hour
- 6 hours
- 24 hours
- 7 days
- 30 days
The selected range affects the following elements:
- service state
- trend
- service state timeline
Summarycolumn in theConnections and Metricstable
By default, the Last 24 hours time interval is selected. Statistics data is automatically updated every 5 minutes.
Service State Timeline
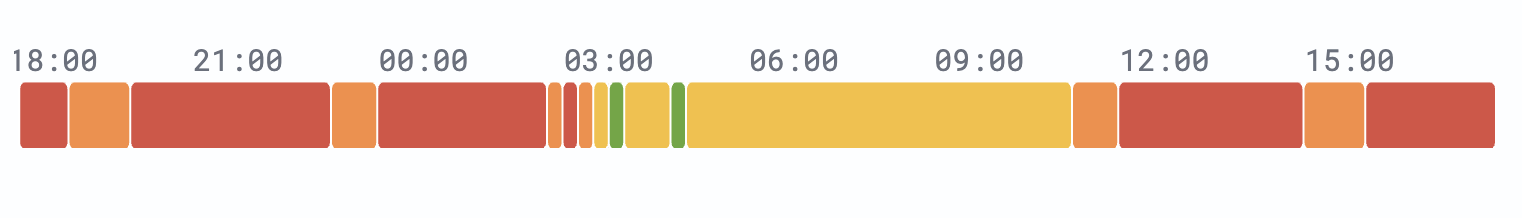
The state timeline displays the distribution of states over a specific time range. This helps to see the duration and sequence of states the service was in.
Block step:
| Interval | Step |
|---|---|
| 1/6/24 hours | 1 minute |
| 7/30 days | 1 hour |
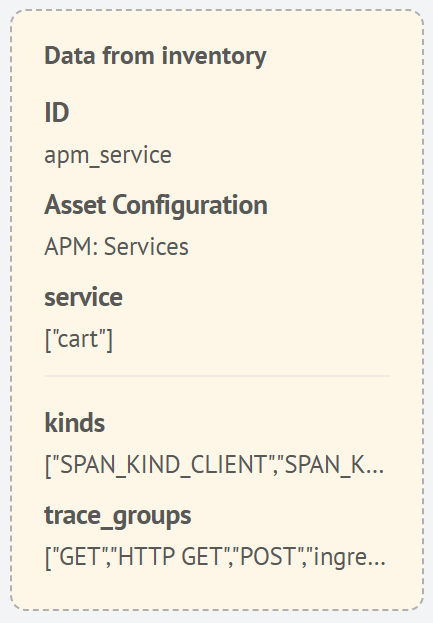
Service Parameters

This block displays service metadata.
| Field | Description |
|---|---|
| Model | Model name to which the service is bound |
| Owner | User who created the service |
| Date of creation | Service creation date |
| ID | Unique identifier |
| Date of update | Last update date |
When synchronizing the model with Inventory, a block with data from Inventory appears in the service parameters.
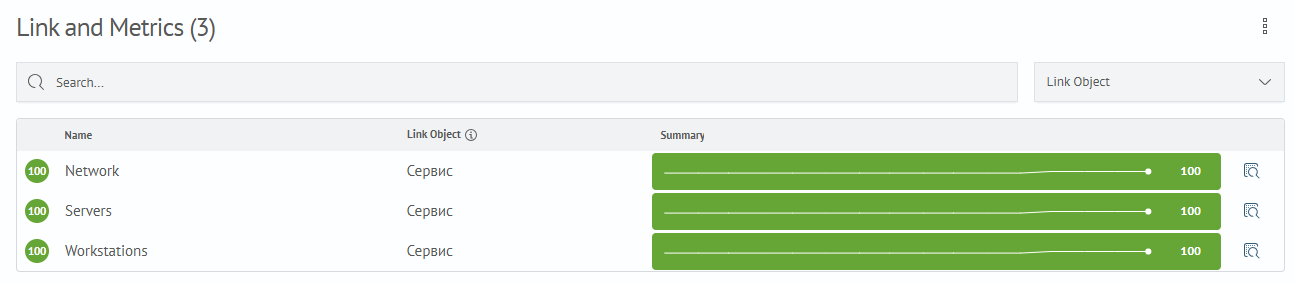
Connections and Metrics
The block displays a table of objects affecting the service state.
Filtering
The table can be filtered using the Search input field or the Connection Object filter.
Sorting
The table can be sorted by the Name and Connection Object fields.
Columns
| Column Name | Description |
|---|---|
| Health Score | Numerical assessment of service health state. |
| Name | Service name. |
| Metric Count | Number of metrics connected from another service (displayed only for Service Metric object type). |
| Connection Object | Type of object connected to the service. |
| Summary | Diagram showing the object state and dynamics of change over the selected time interval. |
Connection object can be of three types:
Metric- Metric connected to the serviceService- Connected serviceService Metric- Connection to another service's metric
Element Actions
Actions for transitioning are provided for each table element. The transition type depends on the object type.
Metric- link transition configured in the metric (if no link exists, the button is not displayed)ServiceandService Metric- transition to the investigation creation page
Clicking on a row transitions to the metric configuration page or service view page.