Metric
Description
A metric allows tracking key service indicators based on collected data and using them to assess service health.
Appointment
Metrics enable:
- monitoring service indicators (both numerical and categorical)
- monitoring service metrics with breakdown by service objects
- analyzing changes in individual service indicators
- fine-tune the matching of metric values to the state of the metric
- fine-tune the effect of the state of individual metrics on the state of the service
Example of numerical and categorical service metrics.
Metric Management
Management is possible in two ways:
- via the service editing page
- via the dedicated metric list page (metric table)
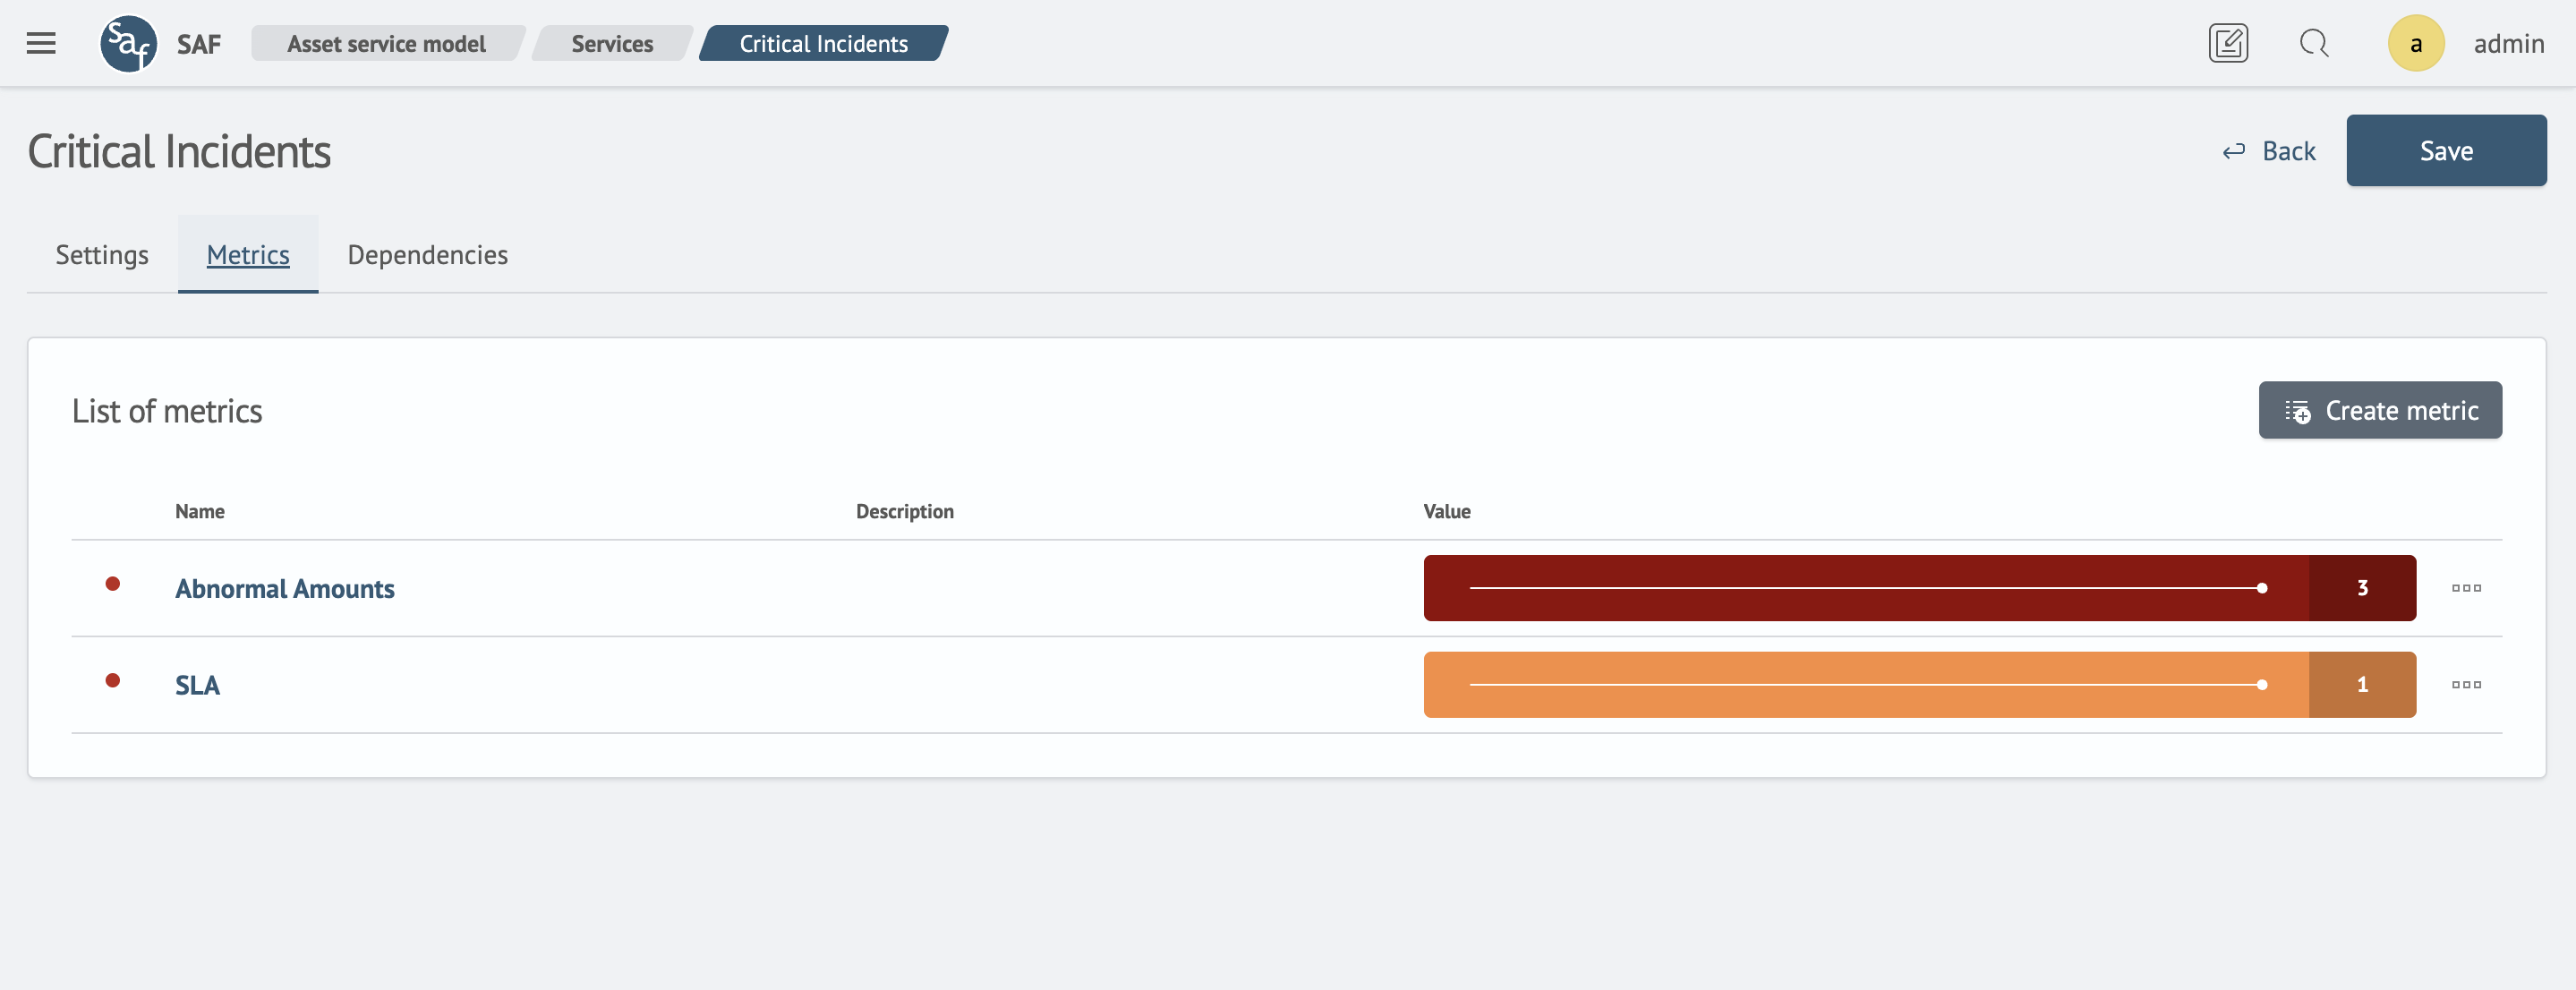
In the first case, you need to navigate to the service editing page.
Then open the Metrics tab to view the metric list.
Available metric operations:
- create metric
- enable/disable metric
- edit metric
- delete metric
When clicking the Save button in the metric editing form modal, all changes are immediately saved to the server.
However, changes made on the service editing page won't be saved until you click Save on the service editing page itself.
Create a Metric
To create a metric:
-
Click the
Create Metricbutton -
Fill out the form in the modal window that appears
-
Click
Save
Edit a Metric
To edit a metric:
-
Click the metric name in the table
-
A metric editing form will open in a modal window
Enable/Disable a Metric
The green or red dot to the left of the metric name indicates its current state: enabled or disabled.
To enable/disable metric value calculations:
-
Click the "three dots" icon to open the context menu
-
Select
disableorenabledepending on the current state
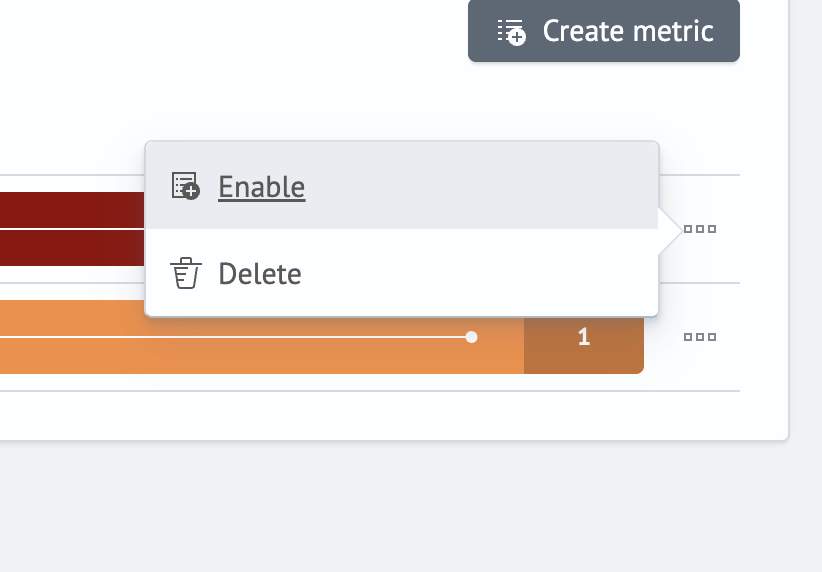
Delete a Metric
To delete a metric:
-
Click the "three dots" icon next to the relevant metric
-
Select
Deletefrom the context menu -
Confirm the deletion
Working with the Metric Table
The second method allows you to manage metrics using a dedicated page. To do this, navigate to the Metric Table section in the main navigation menu. All main management aspects are similar to managing via the service editing page, with the key differences being:
- deletion of multiple metrics at once
- enabling/disabling multiple metrics
- exporting/importing data in JSON format
- search and data filtering by multiple parameters
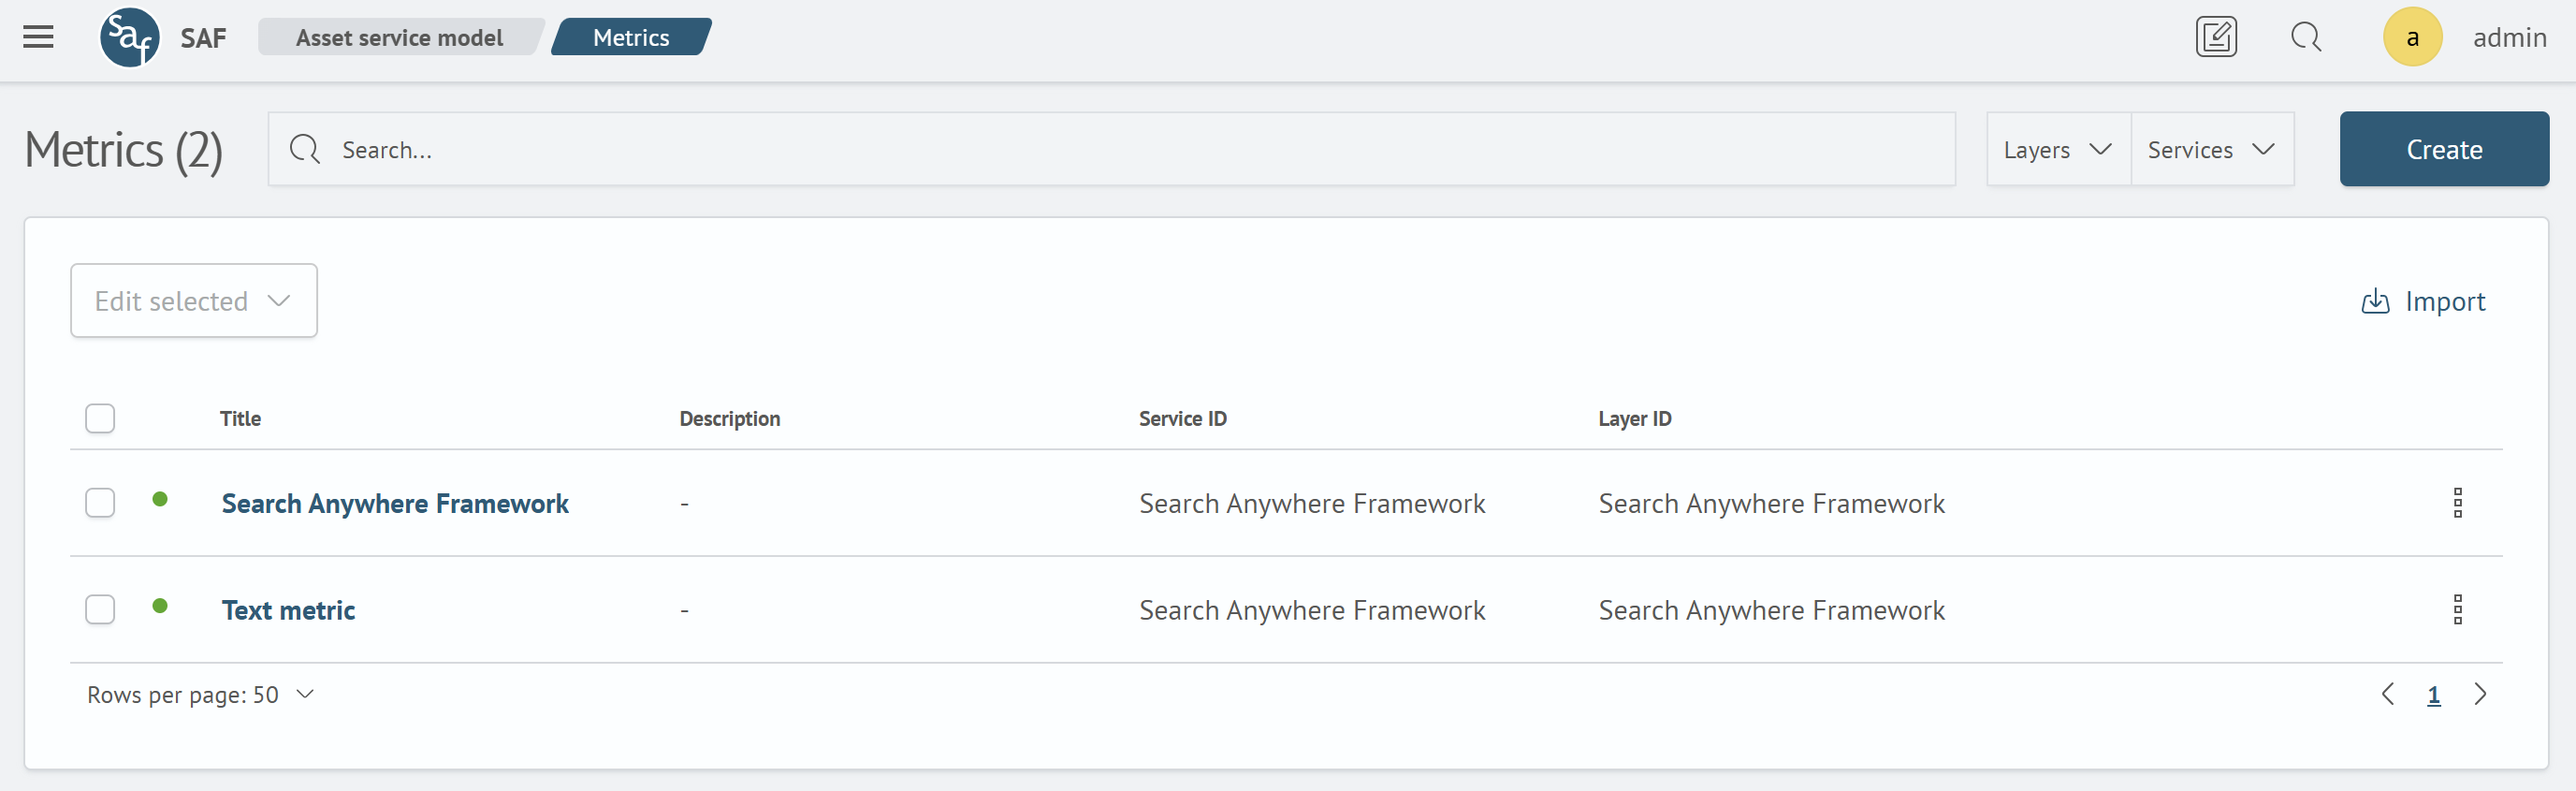
The Metric Table page displays a complete list of all metrics existing in the system. It provides tools for searching, filtering, and managing metrics.
The table may contain metrics intended for analyzing the overall service health. They are highlighted in gray and marked with a "star" icon.
These metrics cannot be edited or deleted on the Metric Table page; editing is only available in the Service Table or on the Layers page.
Interface Overview
The main table contains the following columns:
- Green/red dot next to the name: displays the current metric status:
enabledordisabled - Name: unique metric name
- Description: brief explanation of what the metric measures
- Service: service to which the metric is bound
- Layer: ASM layer to which the metric belongs
Main Actions
The top section of the page contains control elements:
- Search: the
Search...field allows instant filtering of the list by name or description - Filters: the "Layers" and "Services" dropdown lists allow displaying only metrics belonging to the selected categories
- Create: (green button) opens a form to create a new metric
- Export: downloads the current (or filtered) metric list from the system in JSON format
- Import: allows uploading a metric list into the system from a file
Bulk Actions
You can perform actions on multiple metrics simultaneously:
- Select metrics: mark one or more metrics using the checkboxes in the first column of the table
- Actions with selection: after selection, the buttons above the list become active:
- Edit selected: (dropdown) allows applying bulk changes to selected metrics. The dropdown list contains the following items:
- Enable / Disable: allows quickly changing the status of selected metrics (activate or deactivate)
- Delete N metrics: (red button) initiates the deletion process for all selected metrics
- Edit selected: (dropdown) allows applying bulk changes to selected metrics. The dropdown list contains the following items:
Individual Actions
The following options are available for managing each individual metric:
- Editing: clicking on the metric name in the table opens the page for its detailed configuration and editing
- Action menu (three dots): at the end of each row there is a menu that opens a list of quick actions:
- Enable / Disable: allows quickly changing the metric status (activate or deactivate)
- Delete: removes this metric from the system
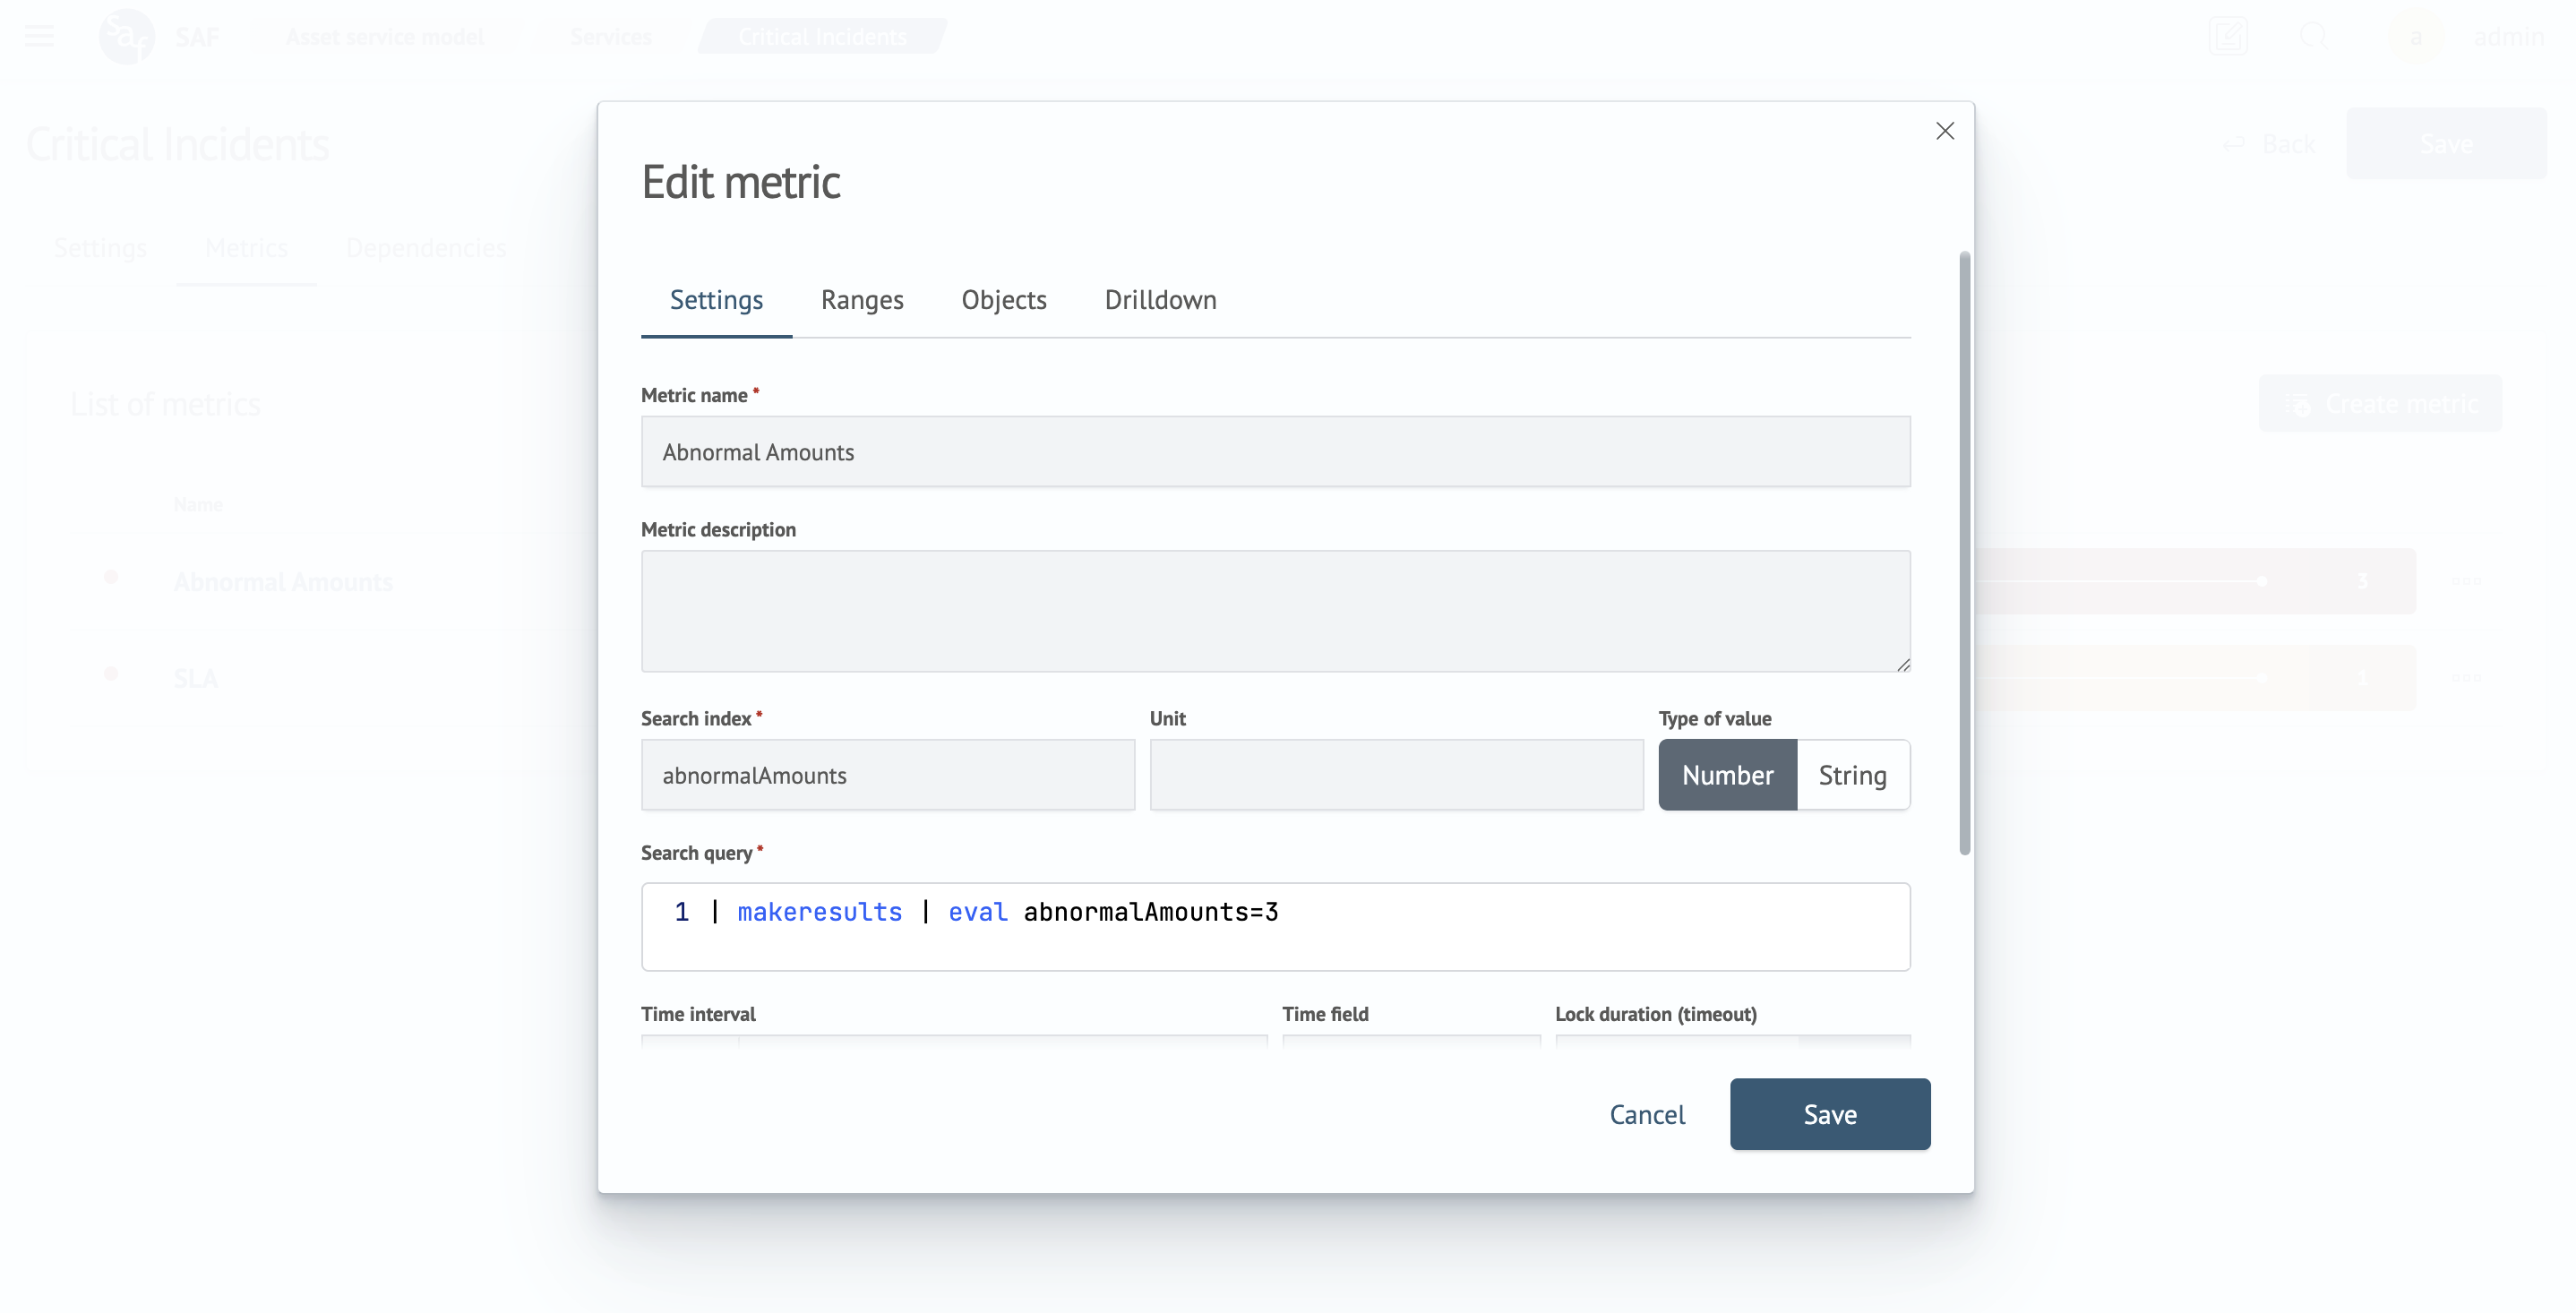
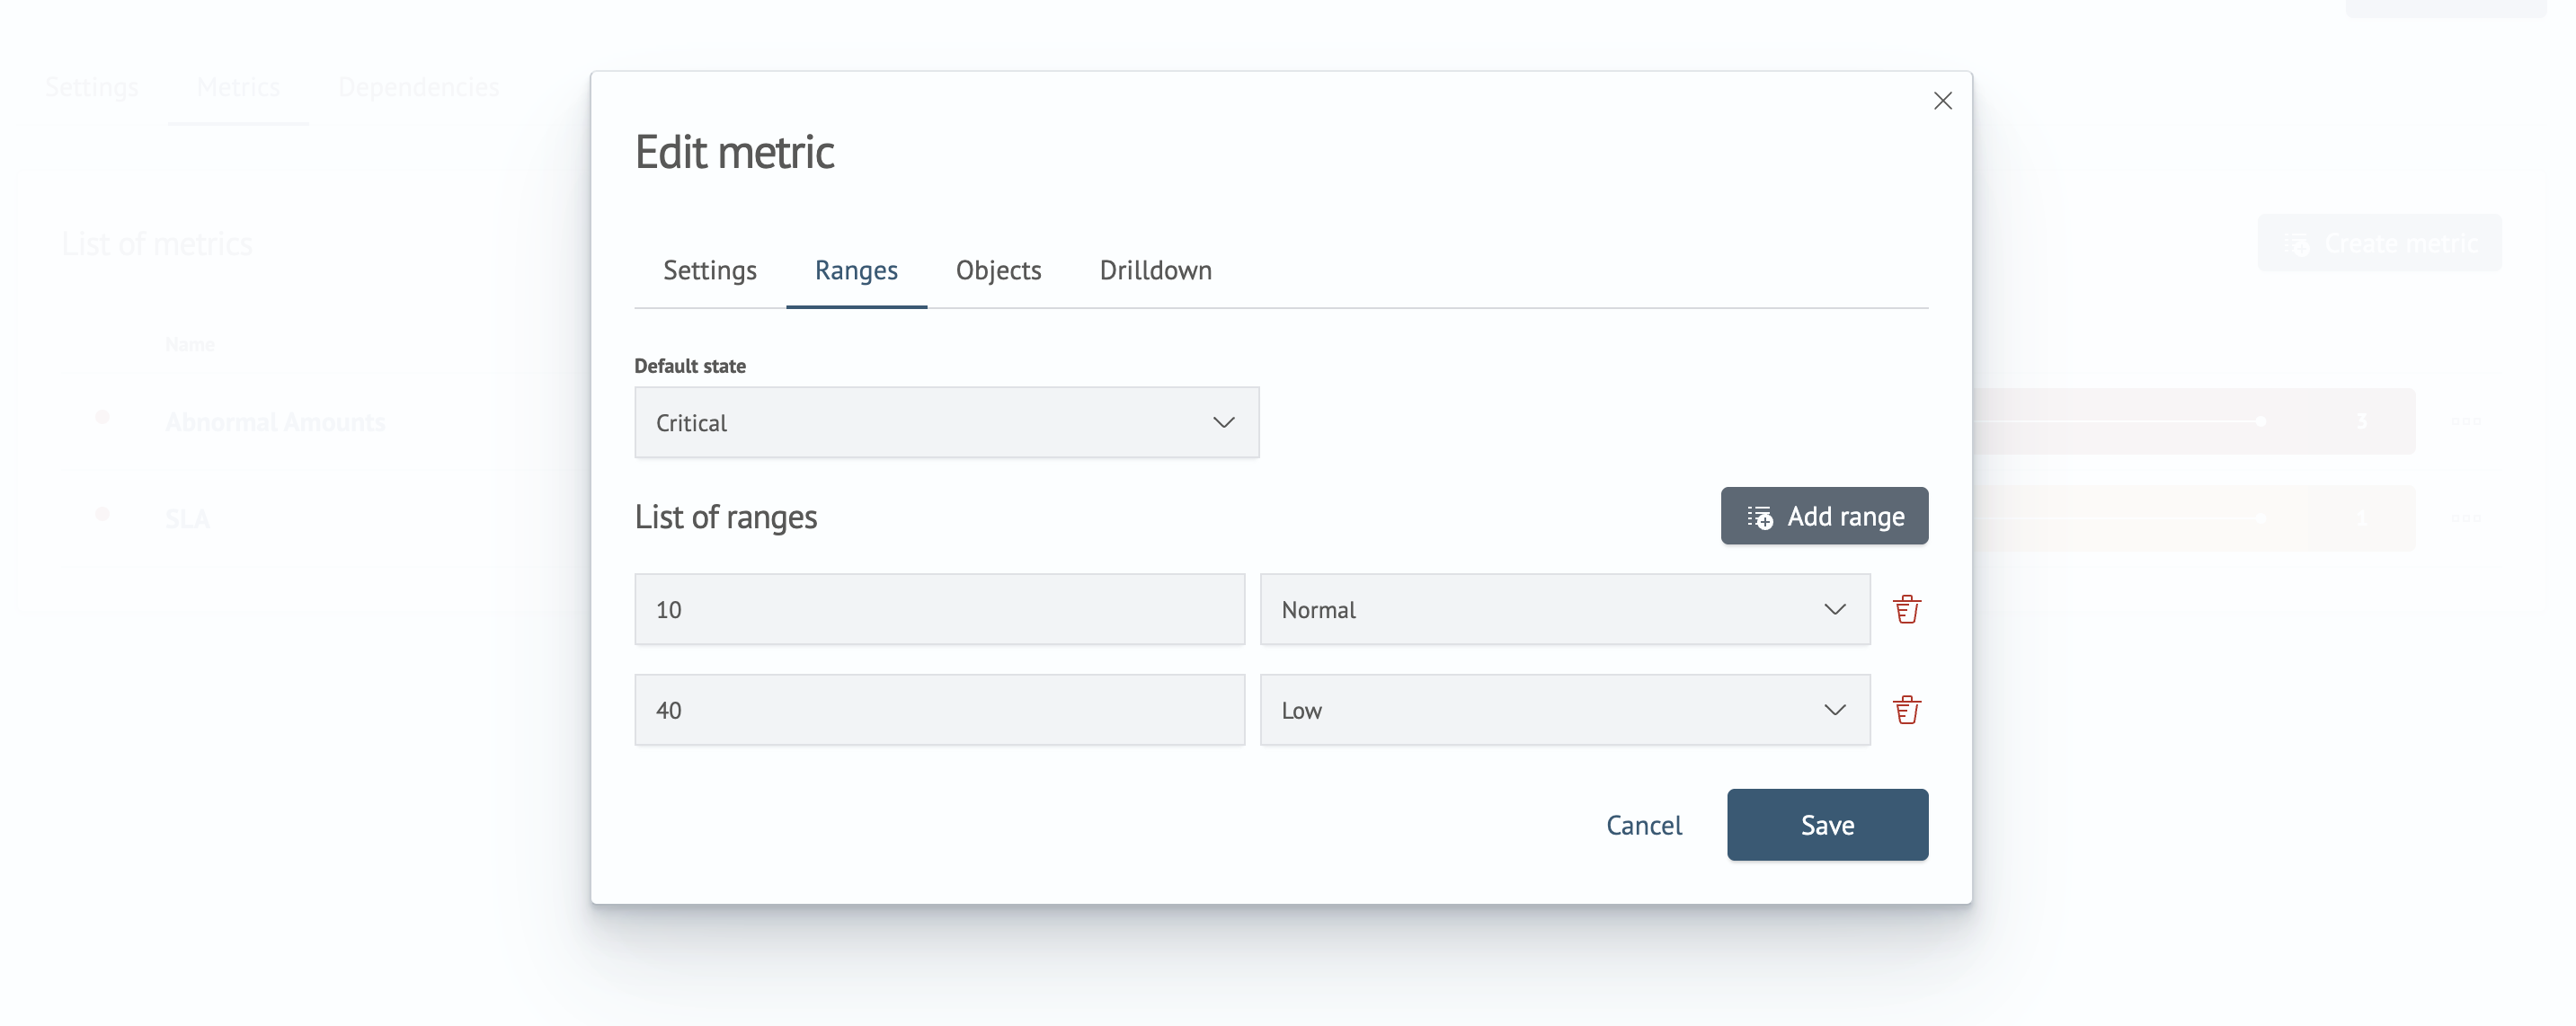
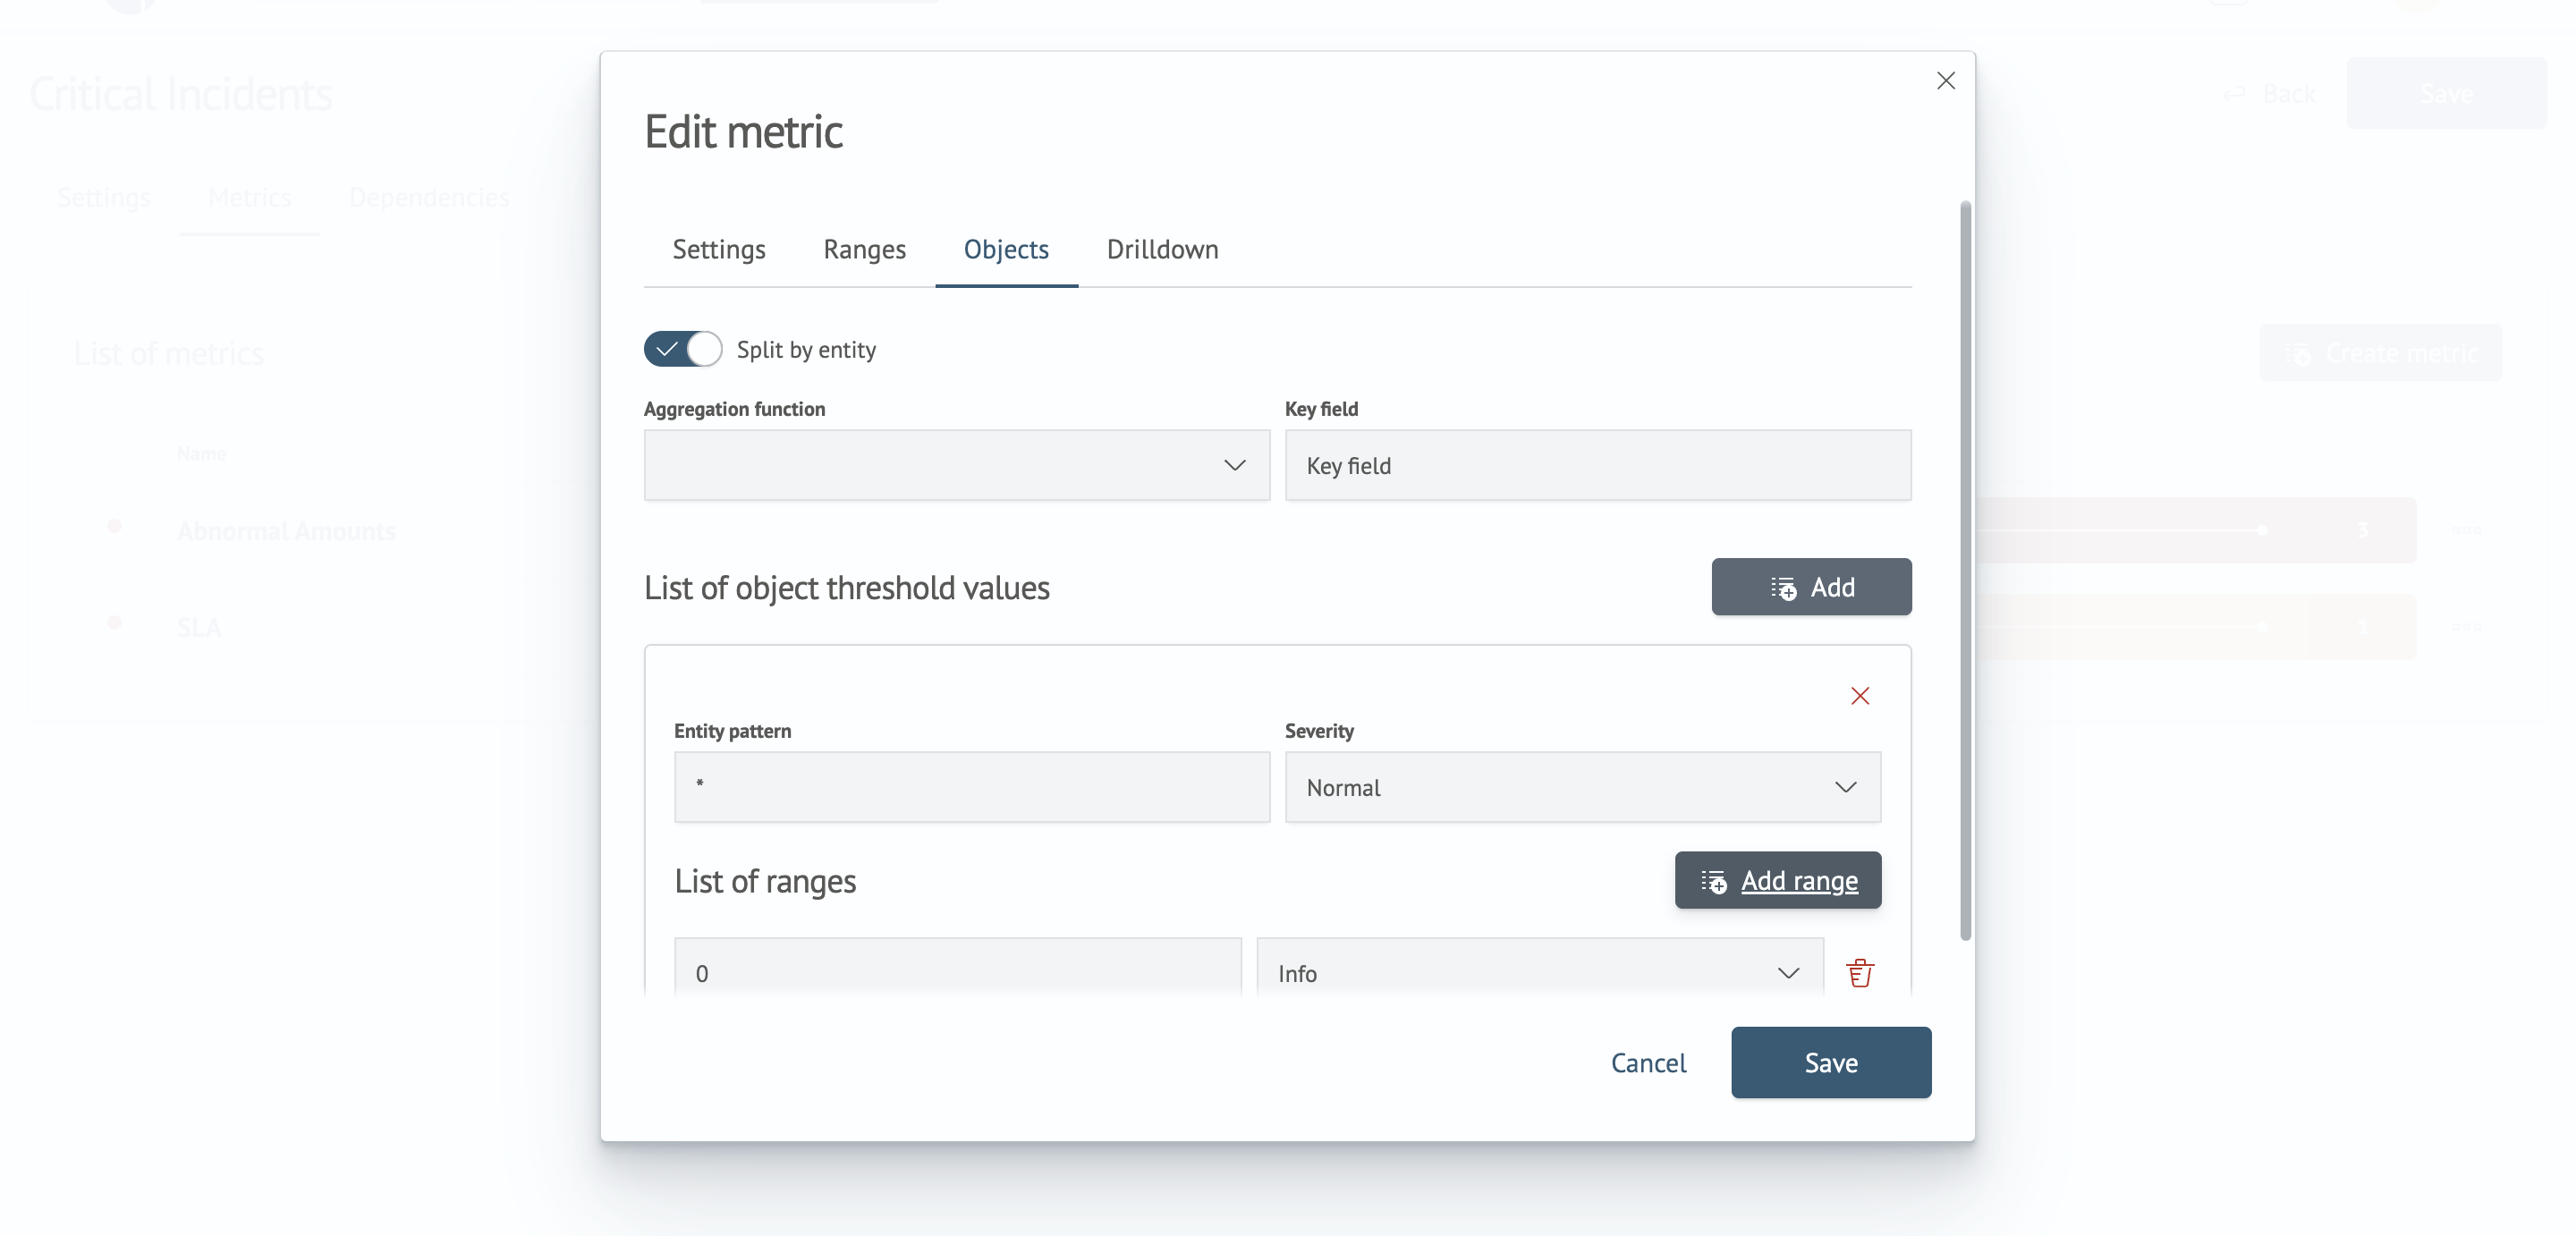
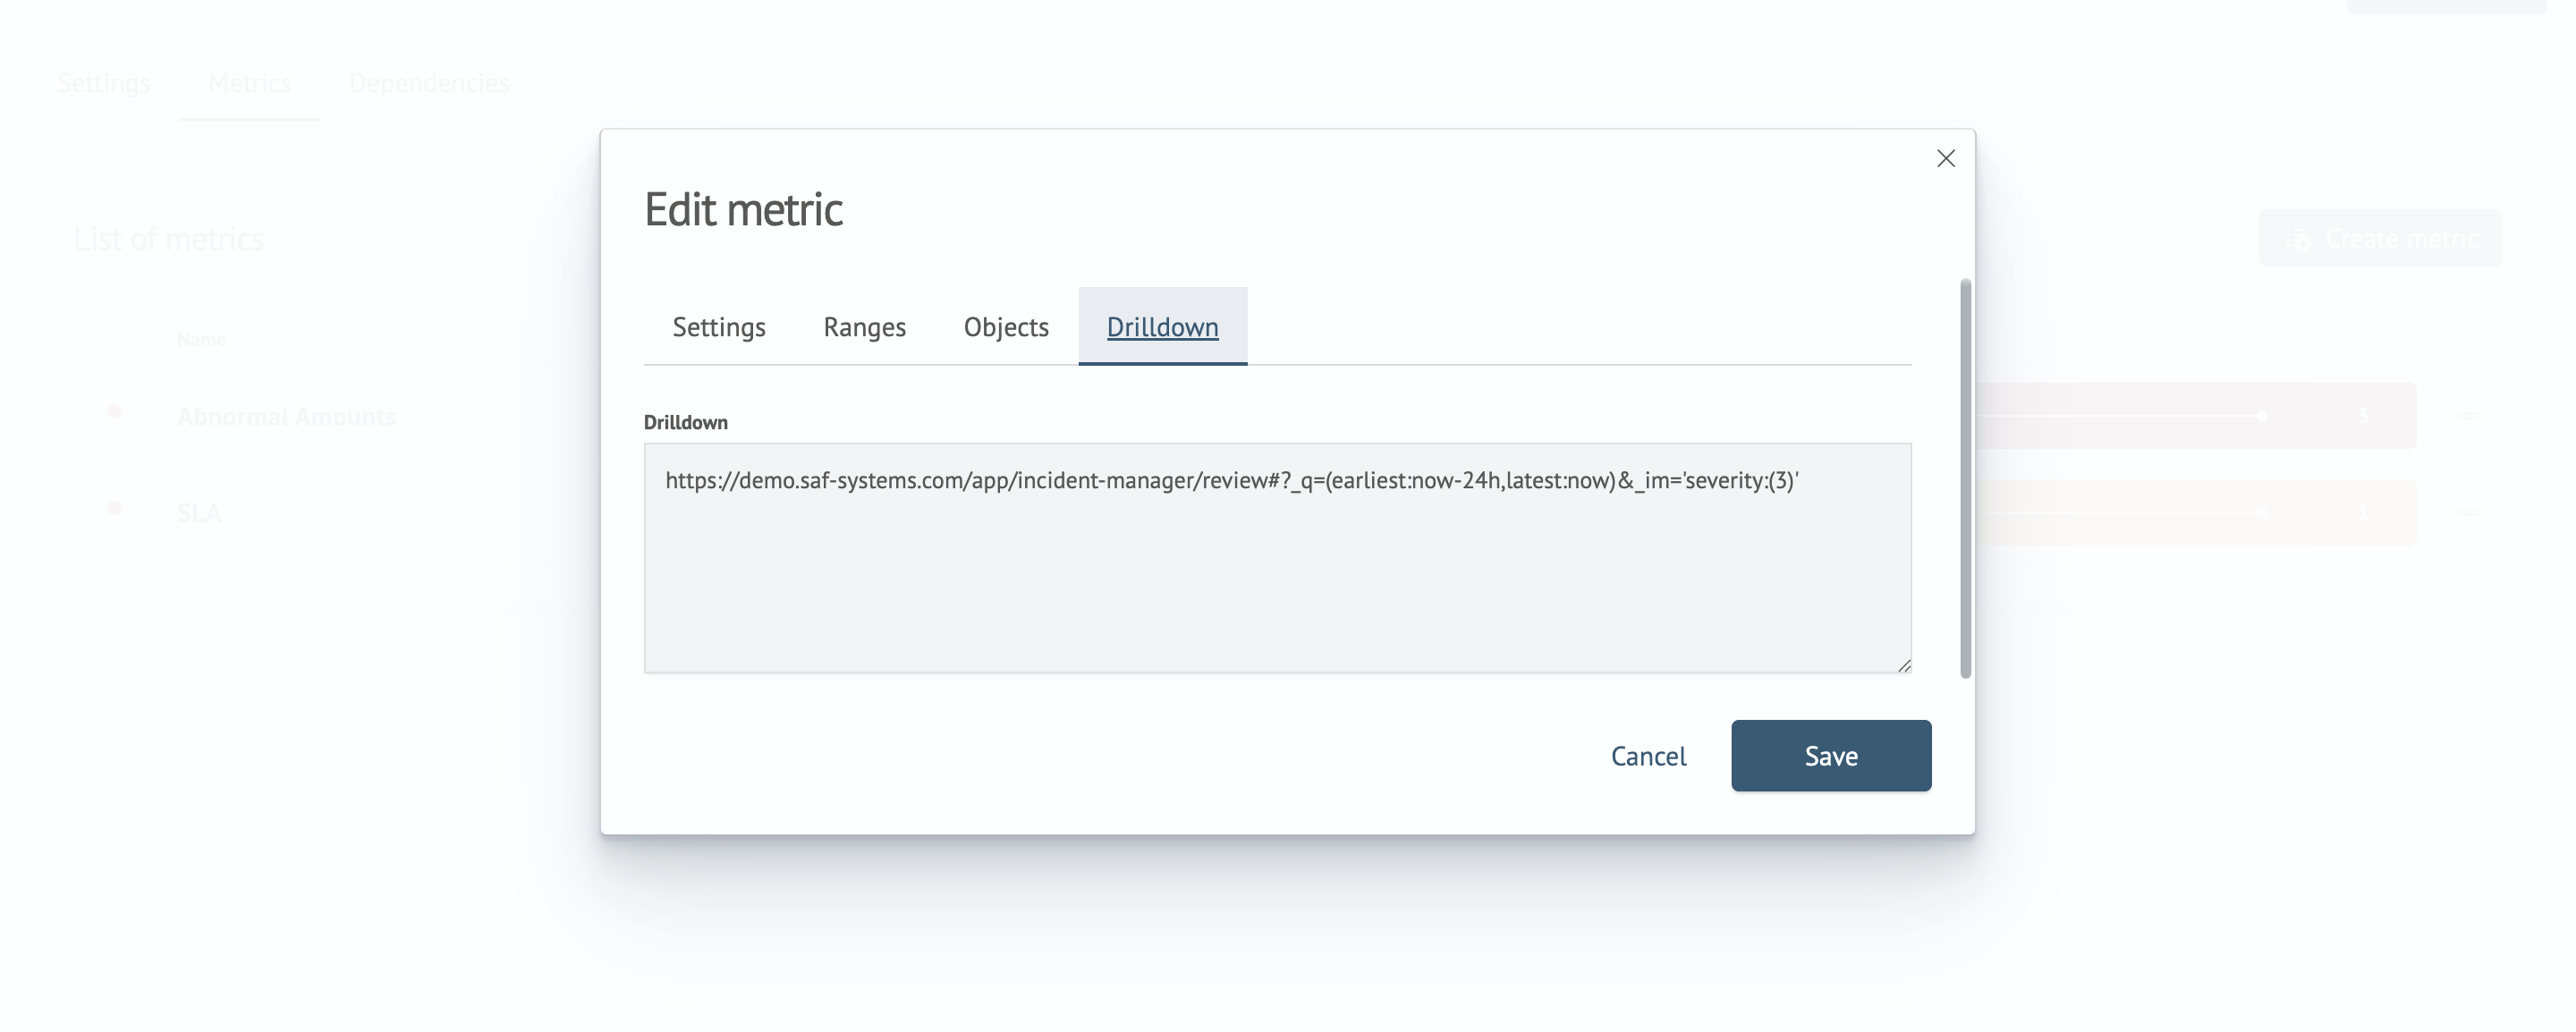
Metric Configuration Form Examples