Tree Map
Overview
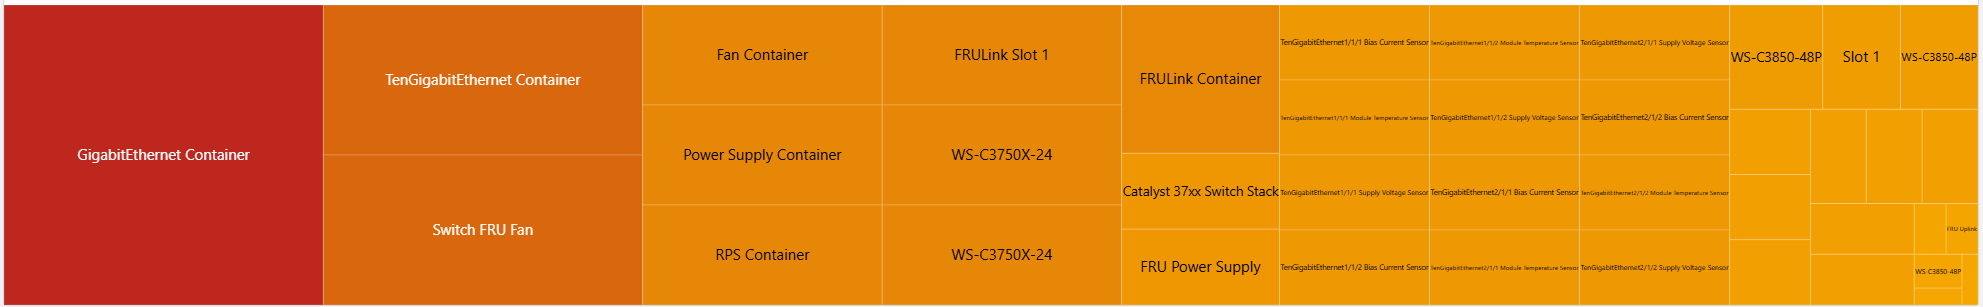 Tree Map - is a type of visualization that displays data as a set of rectangles, with the area of each rectangle being proportional to the numerical value of the corresponding category.
Tree Map Visualization Settings
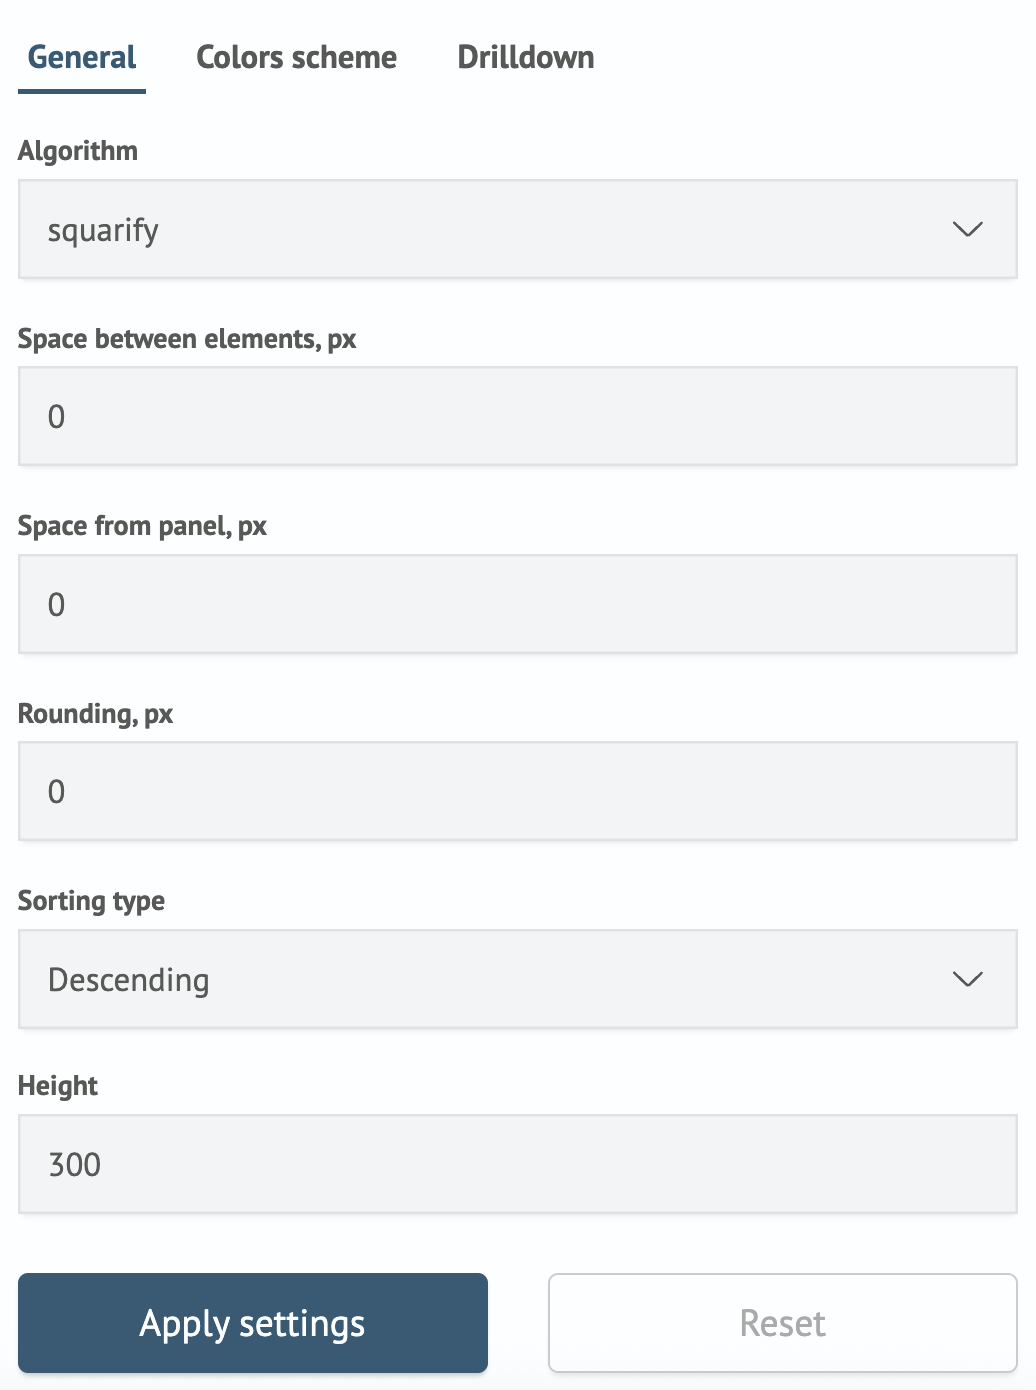
General
The General tab contains options for configuring the primary appearance settings of the visualization.
| Parameter | Description | JSON-field |
|---|---|---|
| Algorithm | Selector to configure the layout of elements | general.layoutAlgorithm |
| Space between elements, px | Numeric field to set the padding between elements | general.nodePaddingInner |
| Space from panel, px | Numeric field to set the padding from the edge of the visualization container | general.nodePaddingOuter |
| Rounding, px | Numeric field to set the corner radius for elements | general.cornerRadius |
| Sorting type | Selector to choose the sorting algorithm for elements | general.sortingType |
The settings interface in the Search Anywhere Framework system looks as follows:
Colors Scheme
In the Colors scheme tab, the color scheme settings for the chart are available. A separate color can be assigned to each series. To do this, click the Add new rule, button and then specify the parameters.
| Parameter | Description | JSON-field |
|---|---|---|
| Field | Data series to which the color should be assigned | color.rulesArray.field |
| Color | Color selector | color.rulesArray.color |
The settings interface in the Search Anywhere Framework system looks as follows:
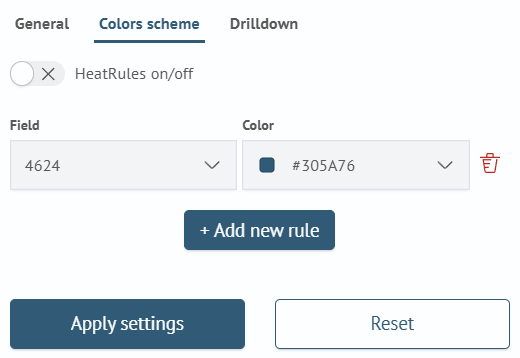
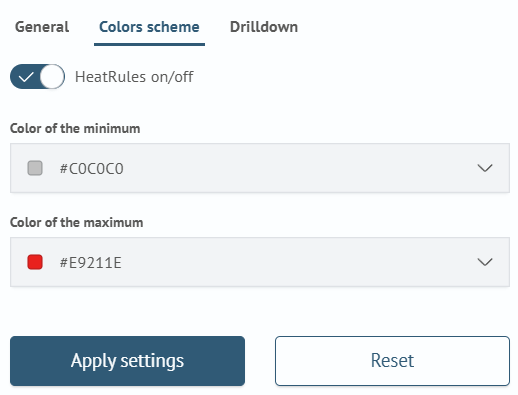
Additionally, using the Colors scheme toggle, you can set an automatic color scheme that colors the chart series based on their numerical values. This mode supports the following parameters:
| Parameter | Description | JSON-field |
|---|---|---|
| Color of the minimum | Color for series with the minimum value | minColor |
| Color of the maximum | Color for series with the maximum value | maxColor |
The settings interface in the Search Anywhere Framework system looks as follows:
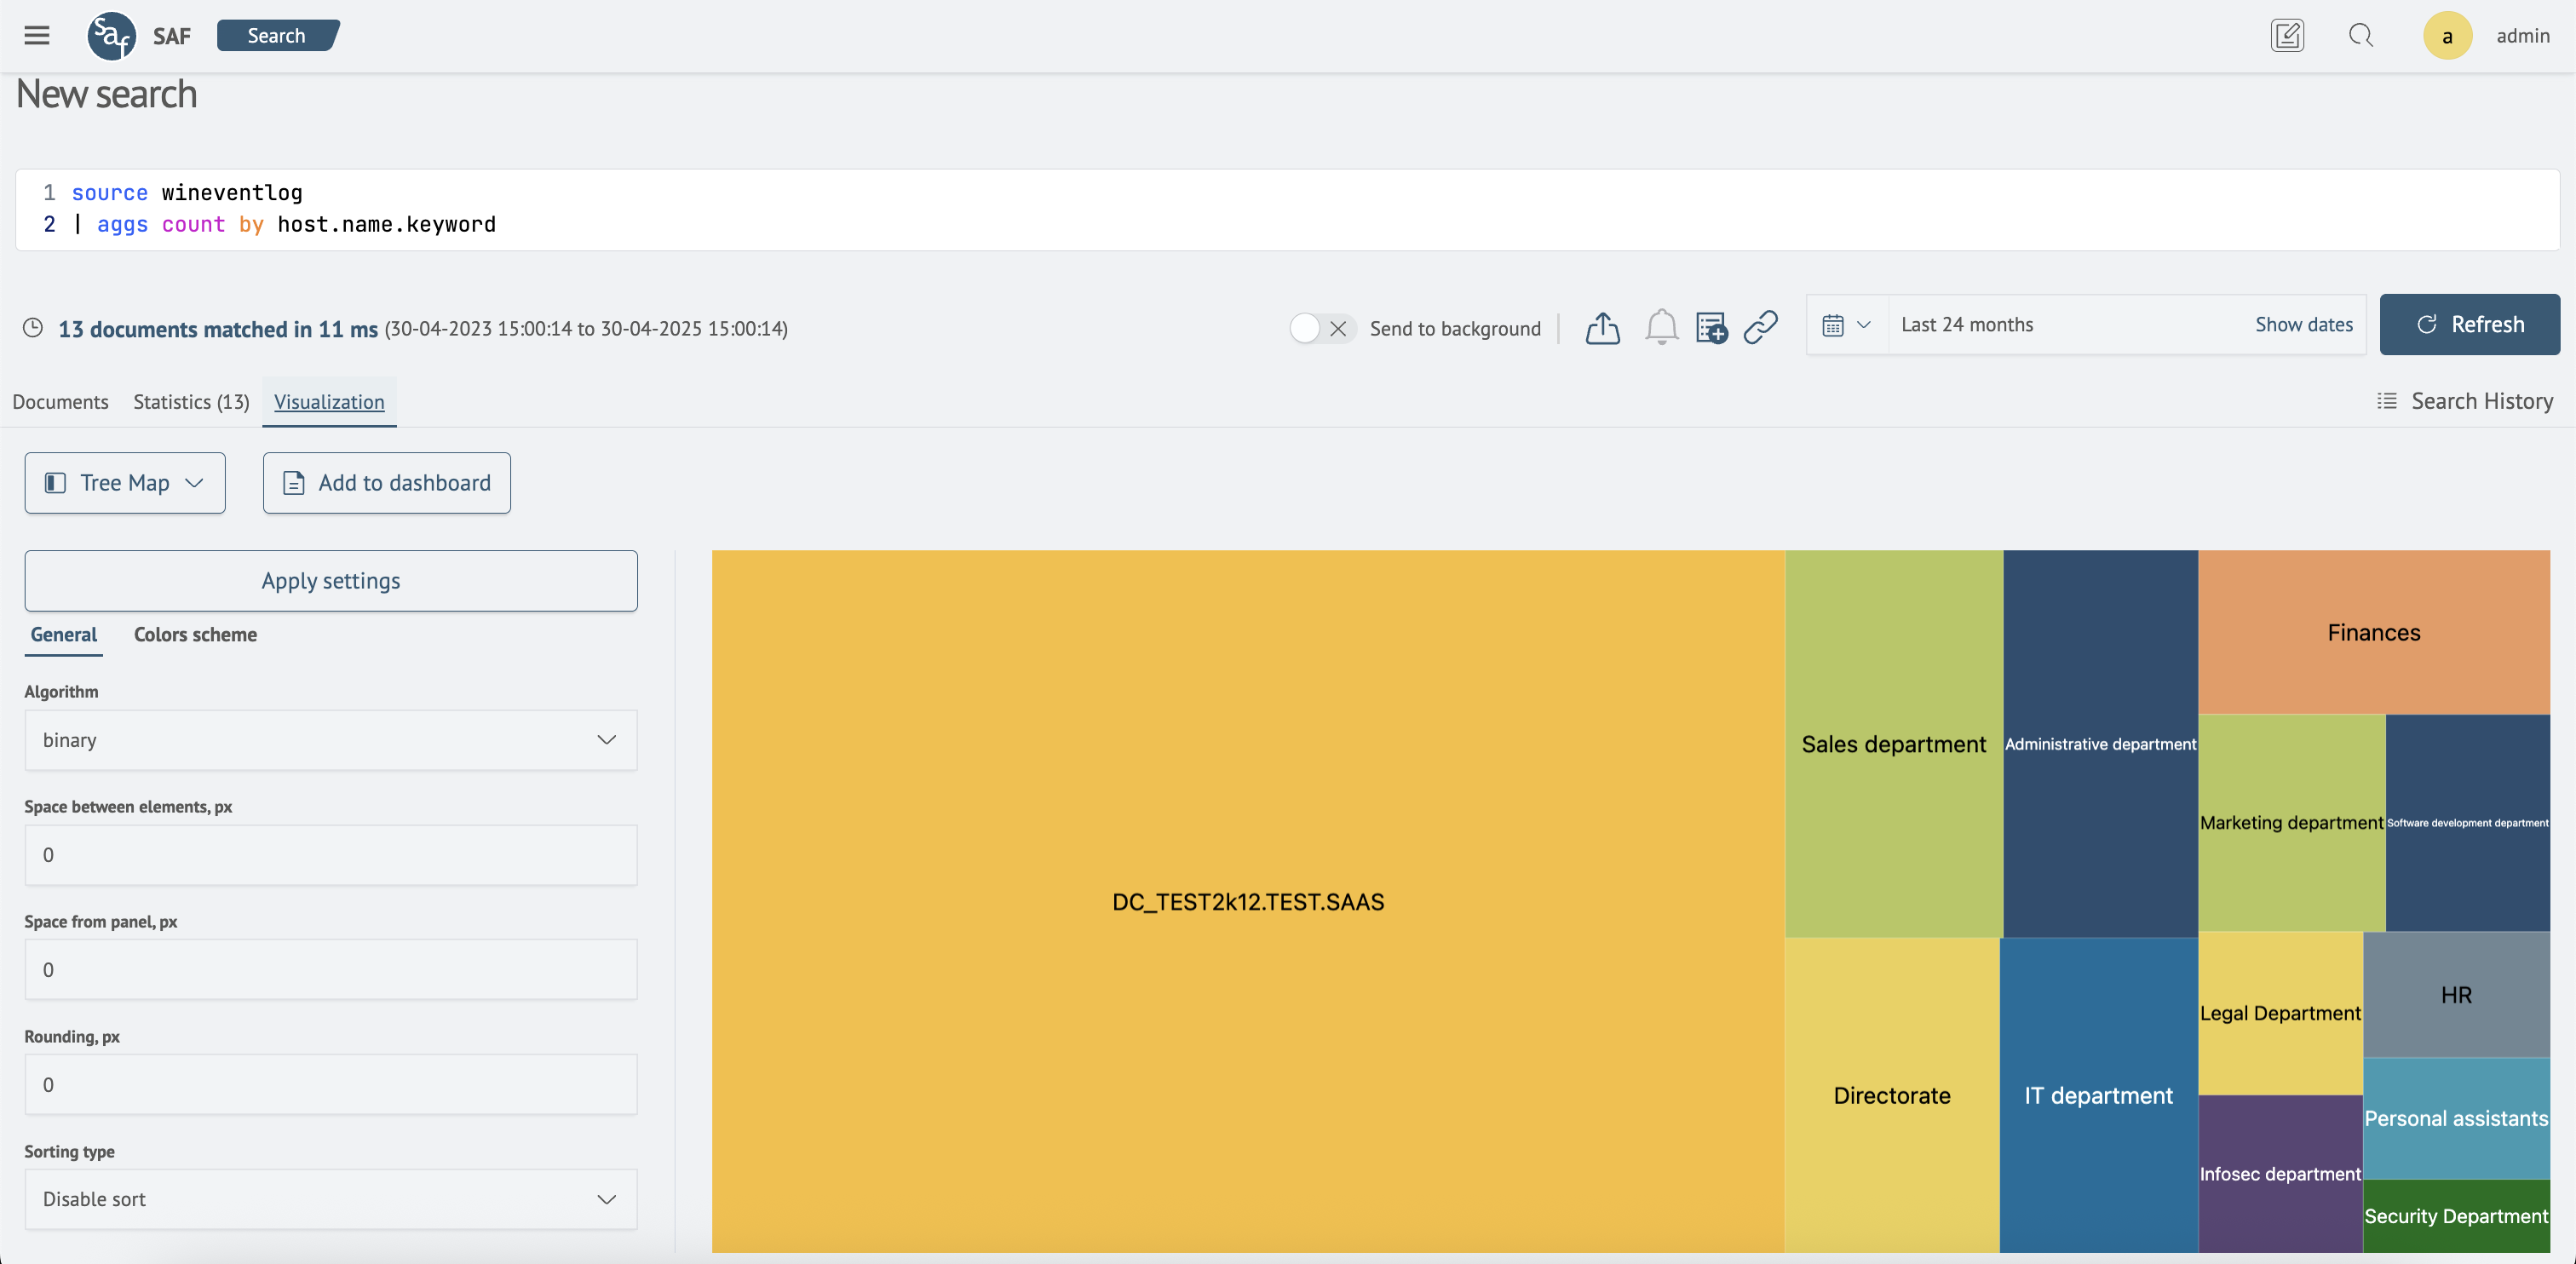
Creating a Tree Map Visualization
A Tree Map visualization can be created when using statistical commands such as: stats, aggs and others. In this case, a table with corresponding statistics will be returned.
For example, the query:
source wineventlog
| aggs count by host.name
Will return the following result:
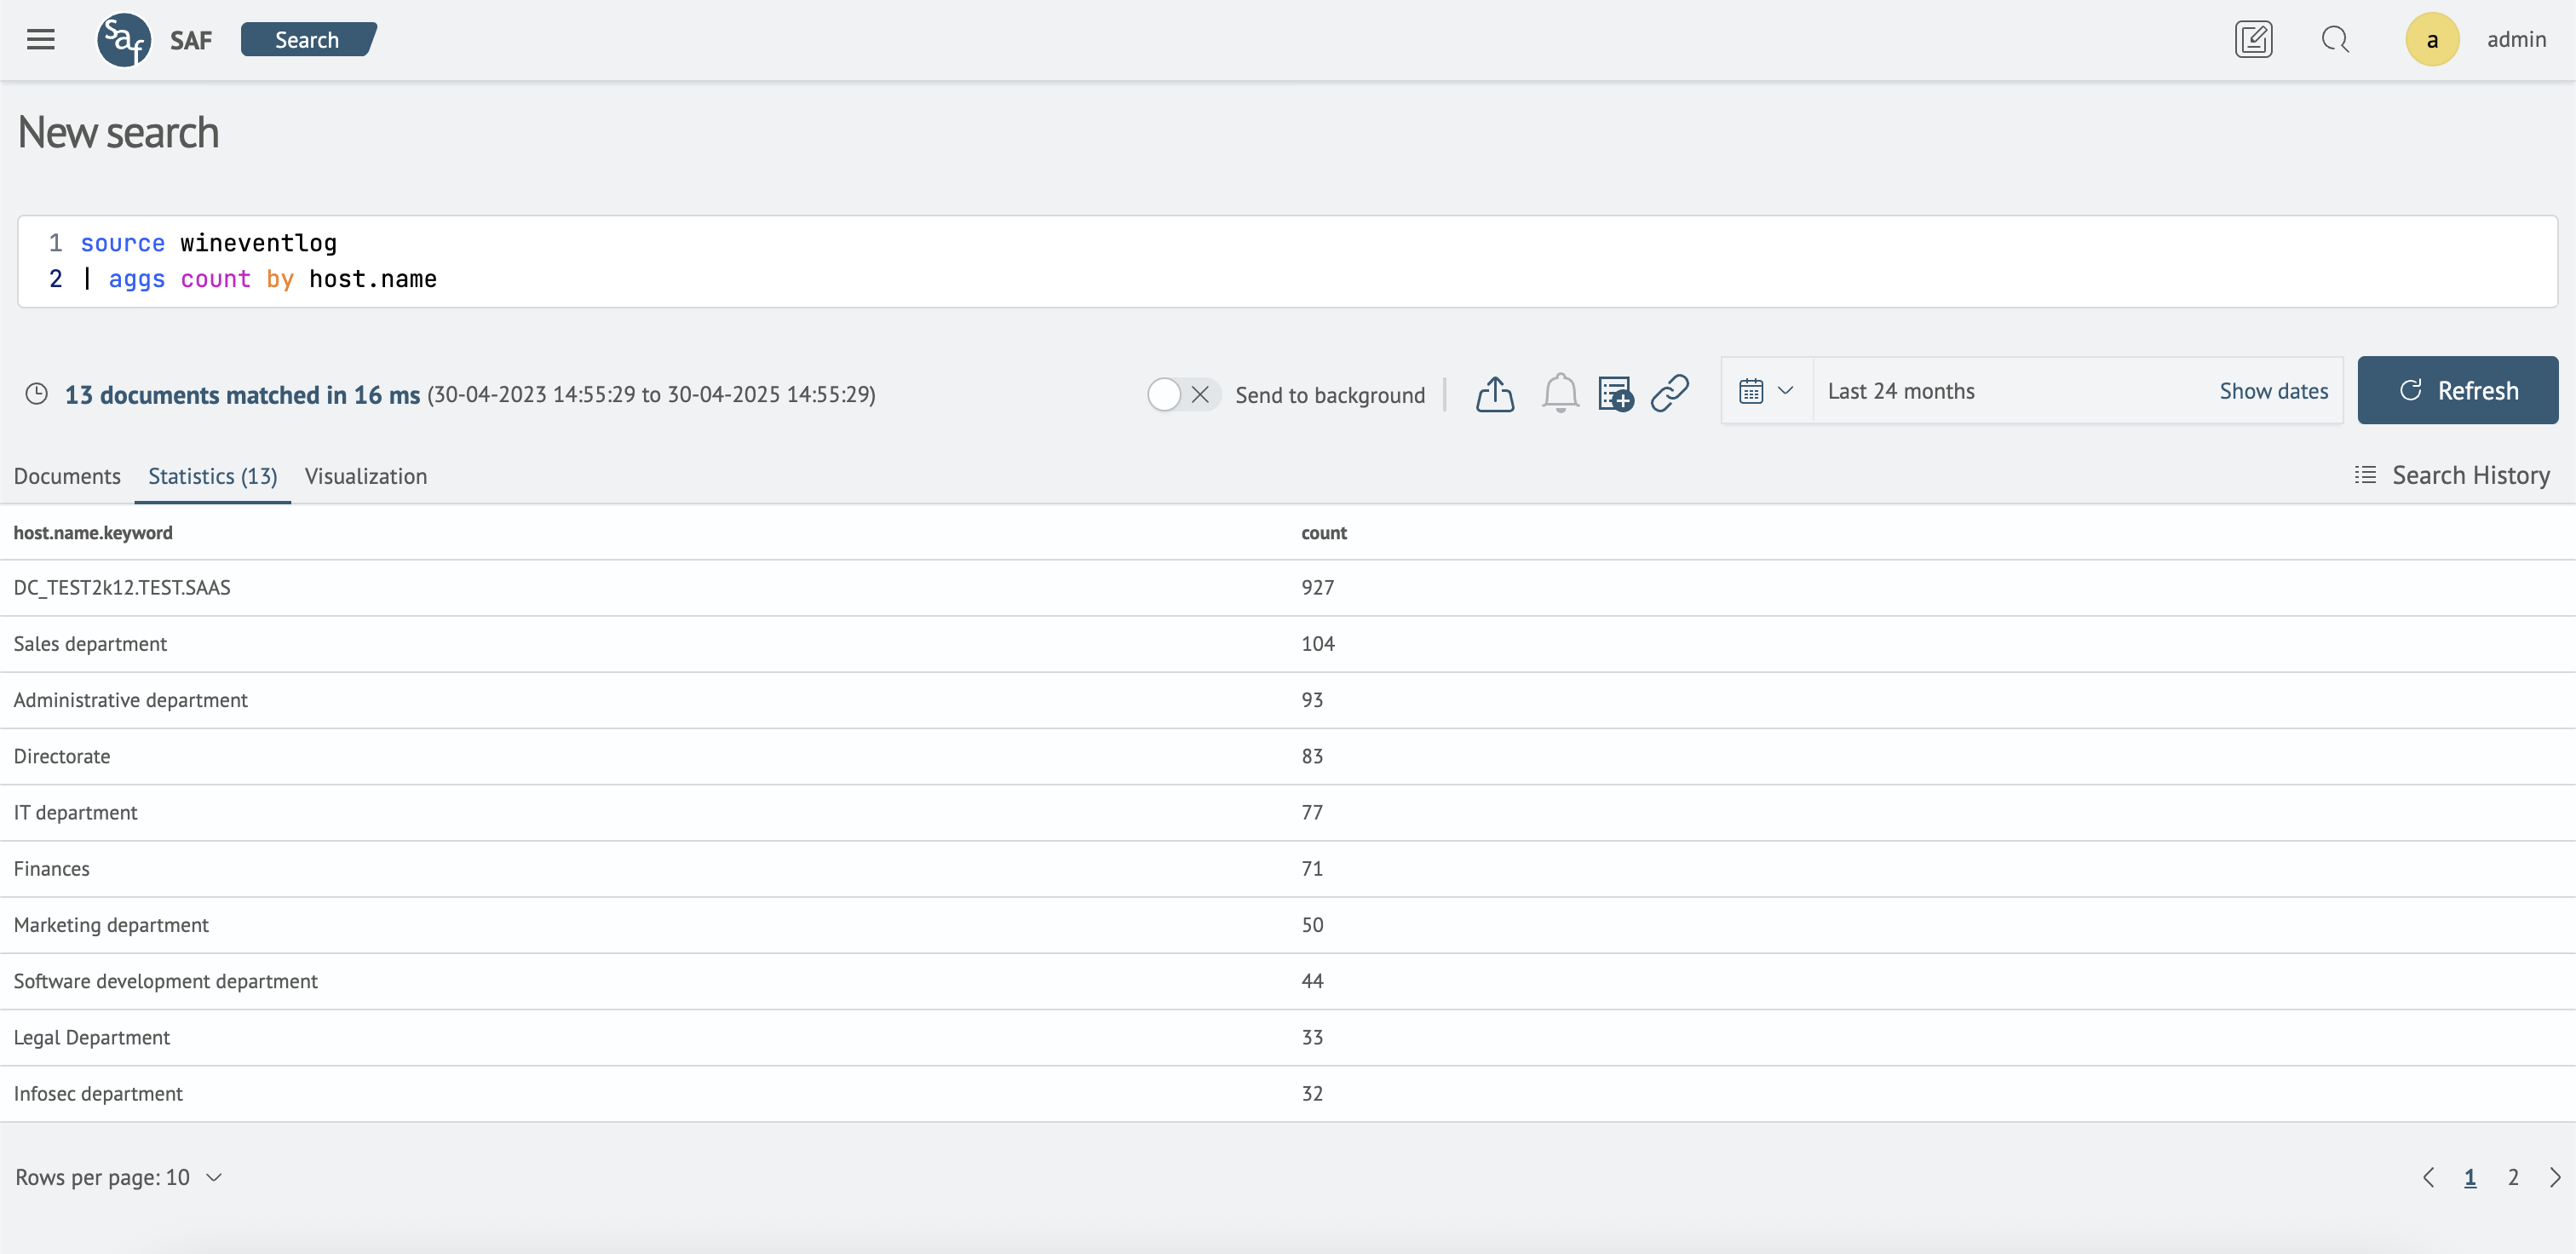
After that, go to the Visualization tab, select the Tree map visualization type, and add it to the desired dashboard by clicking the Add to dashboard button.