Trace Timeline
Overview
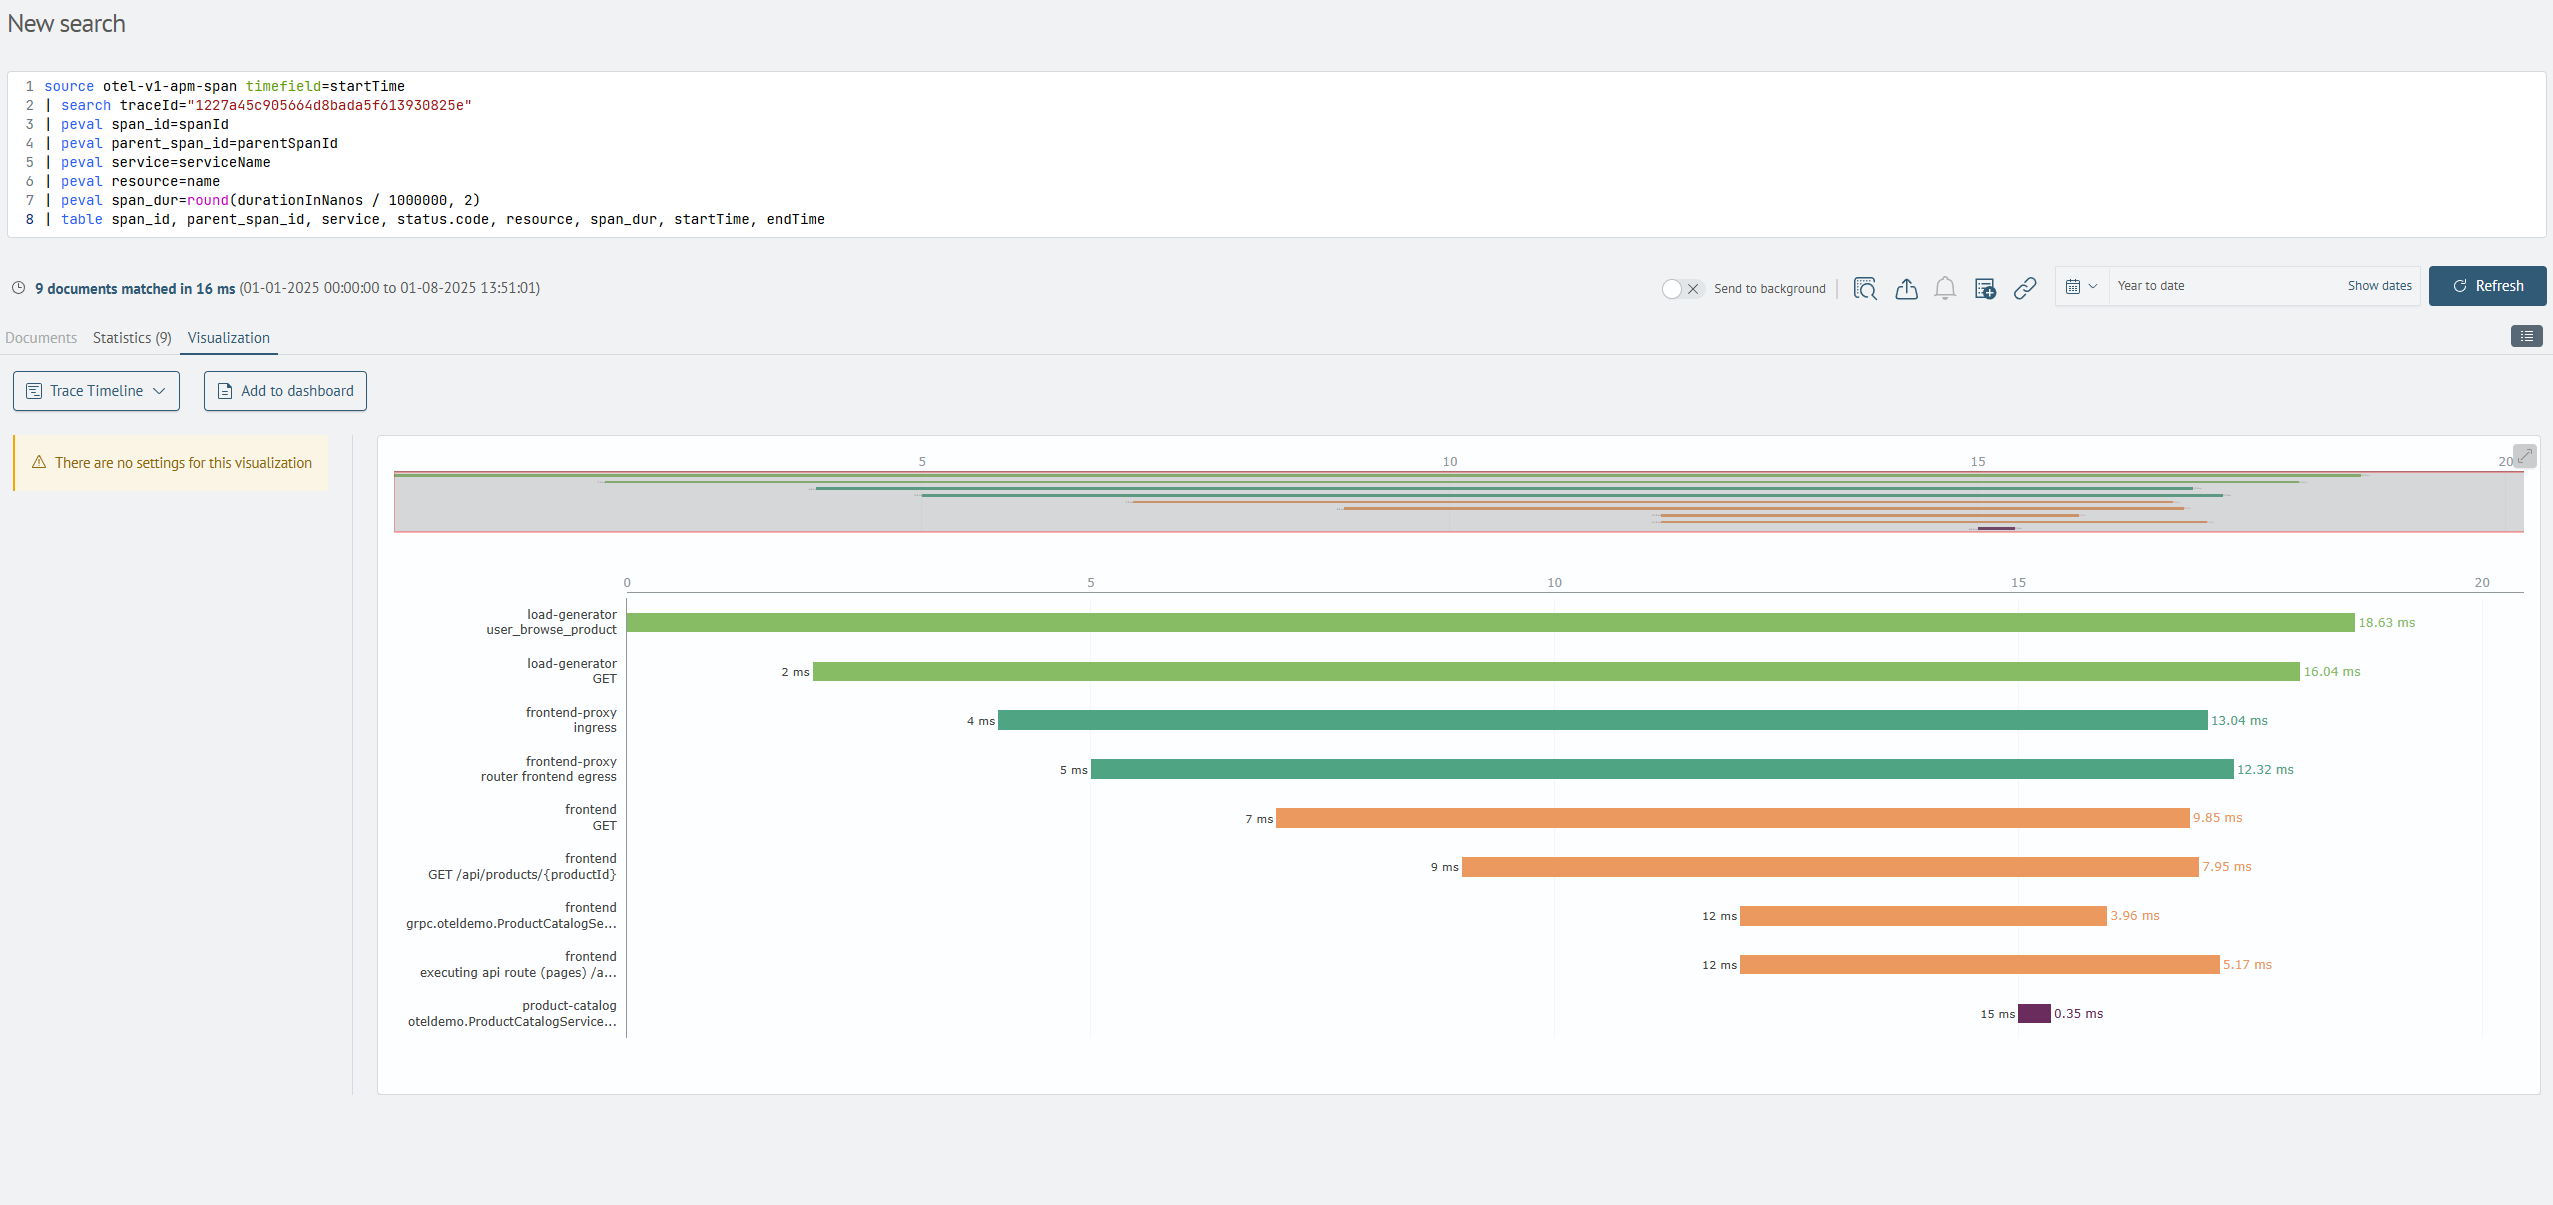
Trace Timeline - is a visualization type that displays operation execution time intervals (traces) as a Gantt chart. It enables analysis of duration, sequence, and parallelism of processes in distributed systems.
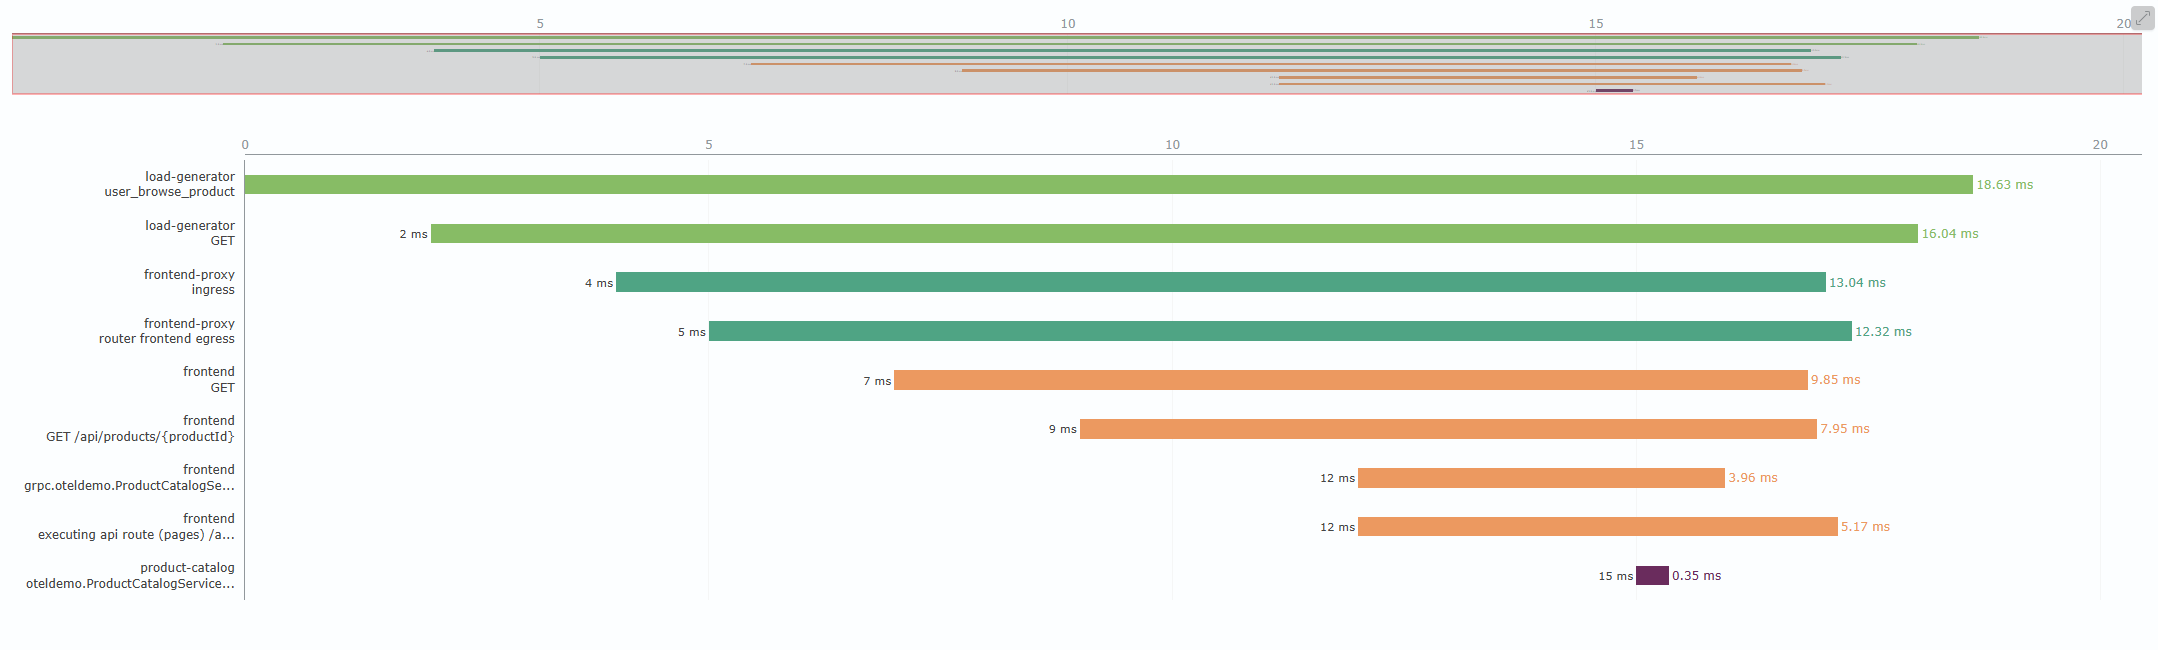
The visualization includes a minimap showing the entire execution time range.
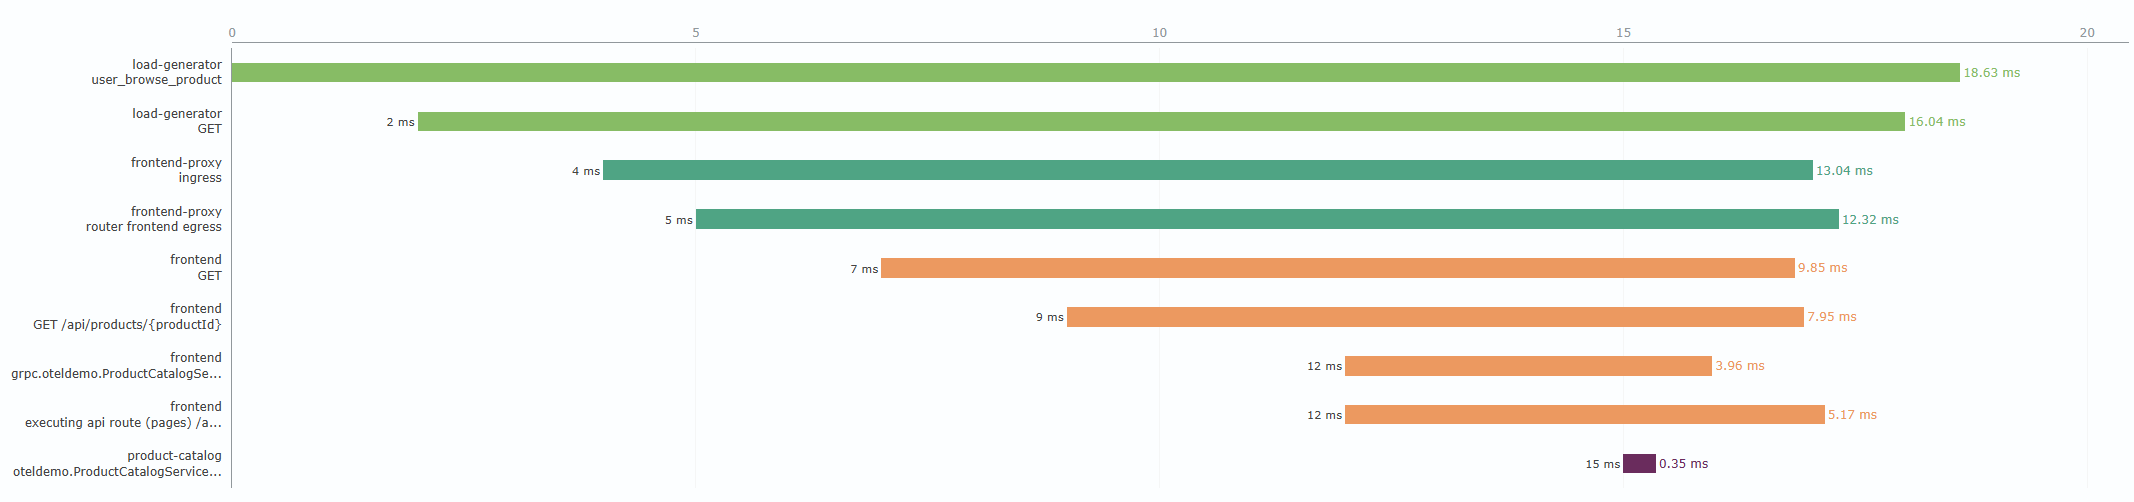
When hovering over a trace, information about the service, source, and duration is displayed.

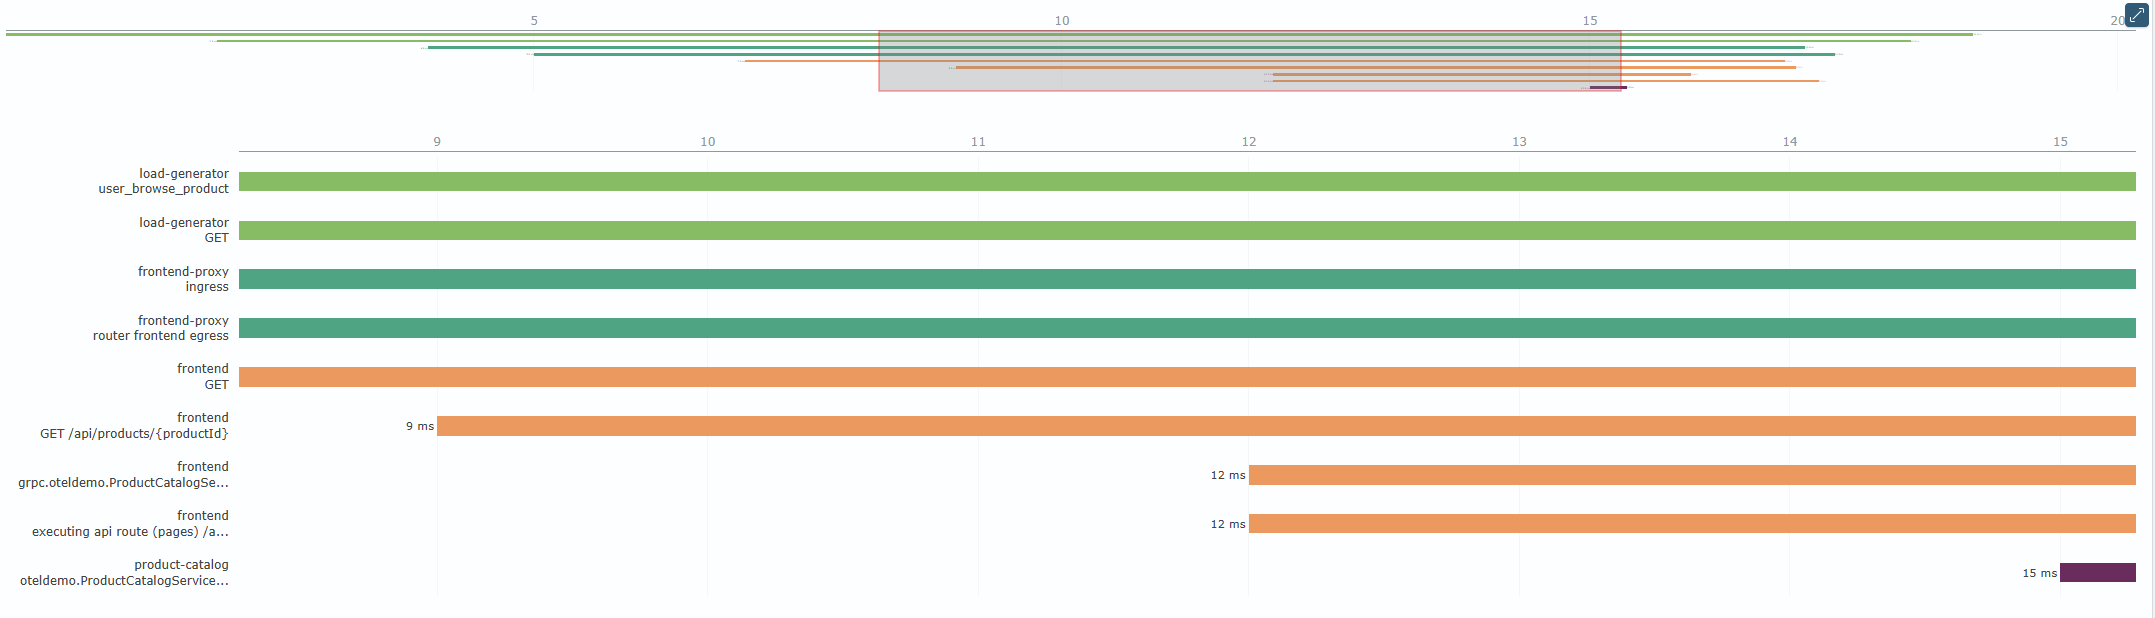
When selecting a time range on the minimap or within the traces, the visualization will show only the selected time period. To reset zooming, click the icon in the upper right corner.
Trace Timeline Visualization Settings
The current version of the visualization has no settings.
Creating a Trace Timeline Visualization
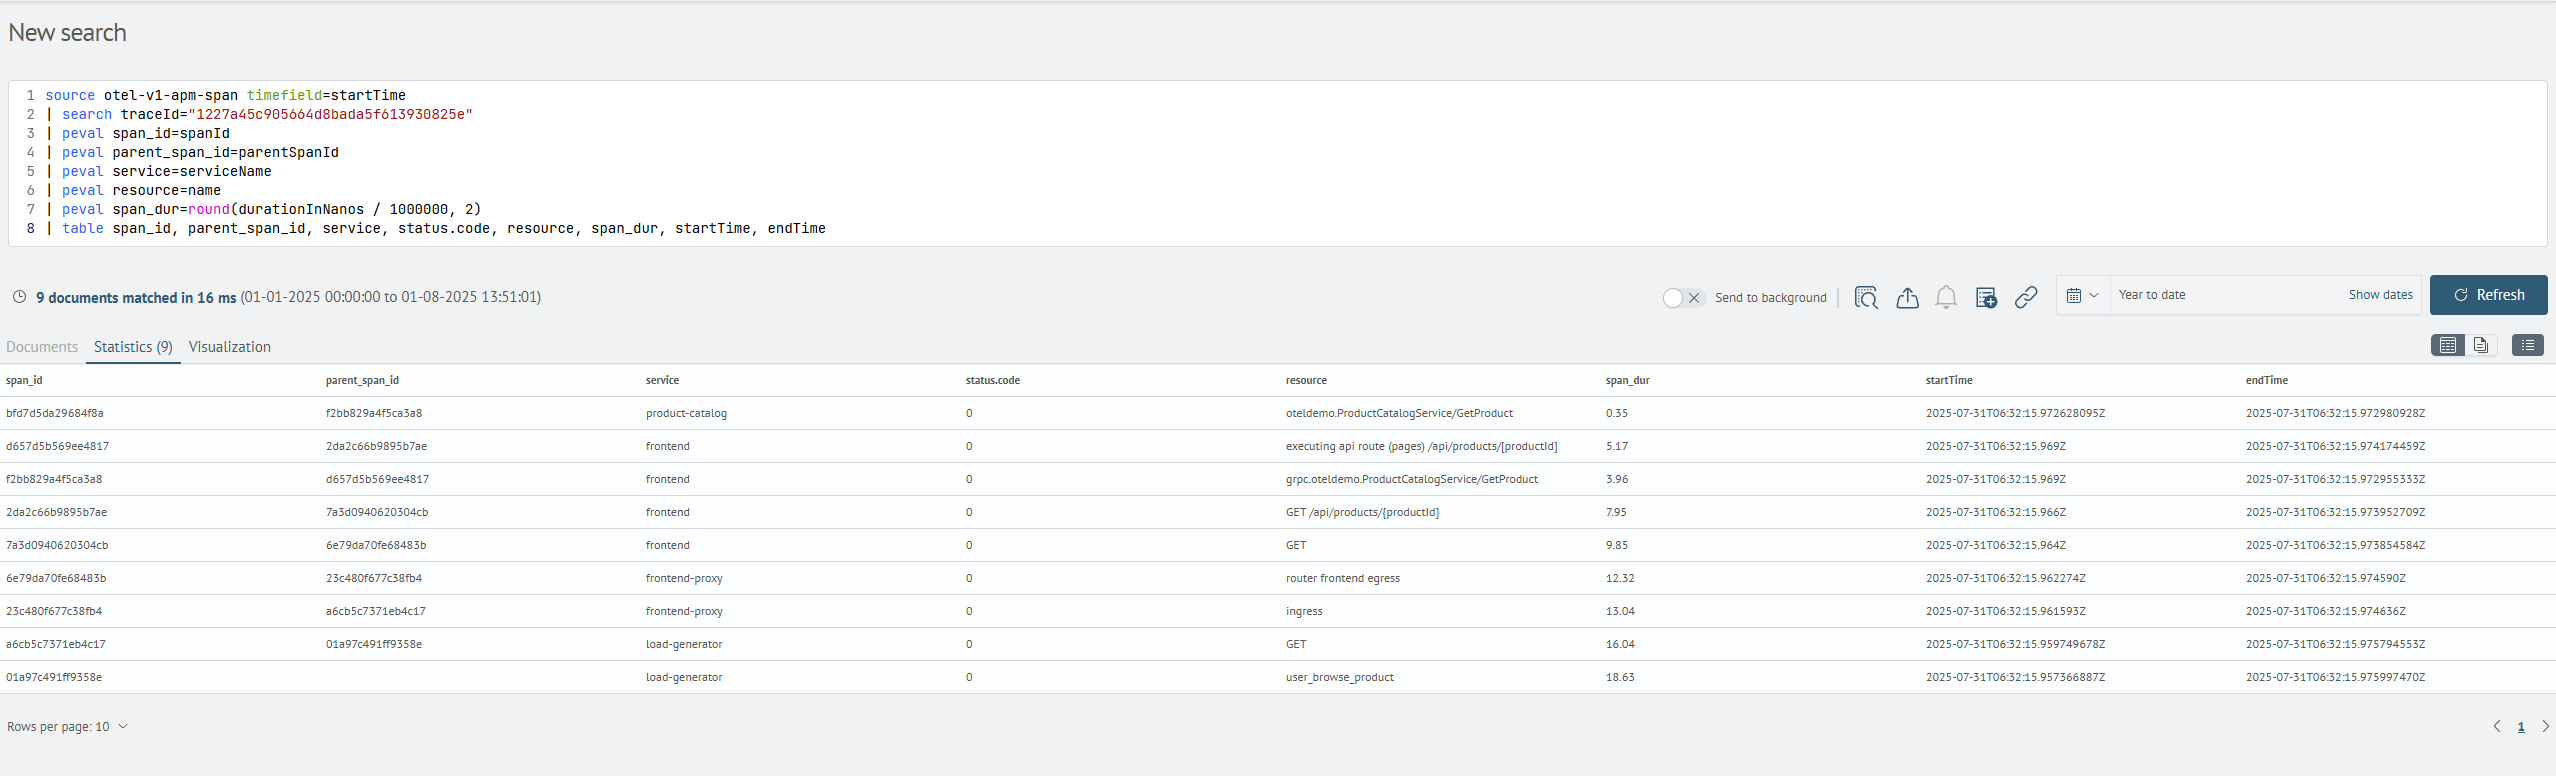
Trace Timeline visualizations can be created when applying statistical commands such as: stats, aggs and others. In this case, a table with corresponding statistics will be returned.
For example, the query:
source win_events
| aggs count by event.code
Will return the following result:
After that, by switching to the Visualization tab, you can select the Trace Timeline visualization type and add it to the desired dashboard by clicking the Add to dashboard button.