Table
Overview
Table is a data presentation method structured as an ordered collection of rows and columns. Each table row represents a distinct record or data item, whereas each column represents a particular attribute or feature of these records. Tables are utilized to organize and visualize data, making it easier to analyze and understand.
Settings
General
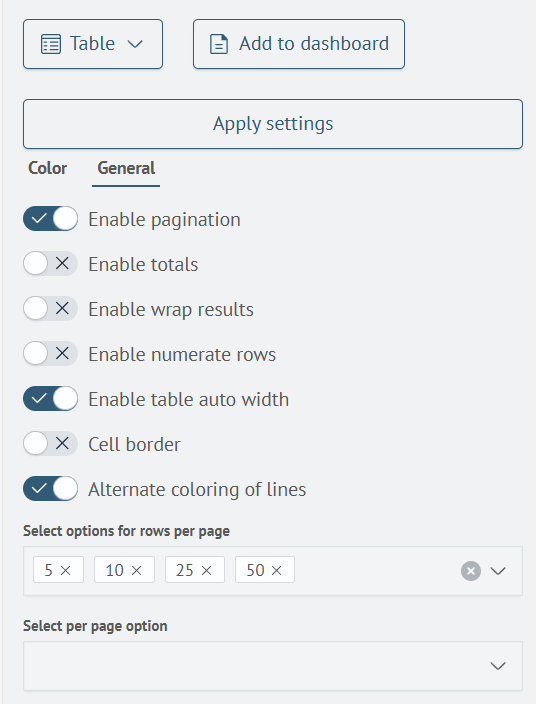
The table features the following settings within the General tab:
| Setting | Description | JSON-field |
|---|---|---|
| Enable pagination | A toggle that enables or disables page-based navigation through a table. | pagination.enabled |
| Enable totals | A toggle that enables or disables column statistics. | summary.enabled |
| Enable wrap results | A toggle that enables wrapping text within a cell. | isWrapResults |
| Enable numerate rows | A toggle that enables or disables row numbering. | hasNumberOfRows |
| Enable table auto width | A toggle that enables or disables automatic column width calculation. | tableAutoWidth |
| Rows per page | A number list input field that allows setting the number of rows per page. A corresponding selection appears on the visualization. | pagination.rowsPerPageList |
| Per page option | A selection that allows setting the default number of visible rows in a table. The list of selection options is chosen from the list specified in the Rows per page parameter. | pagination.rowsPerPageDefault |
Search Anywhere Framework general settings window:

Color
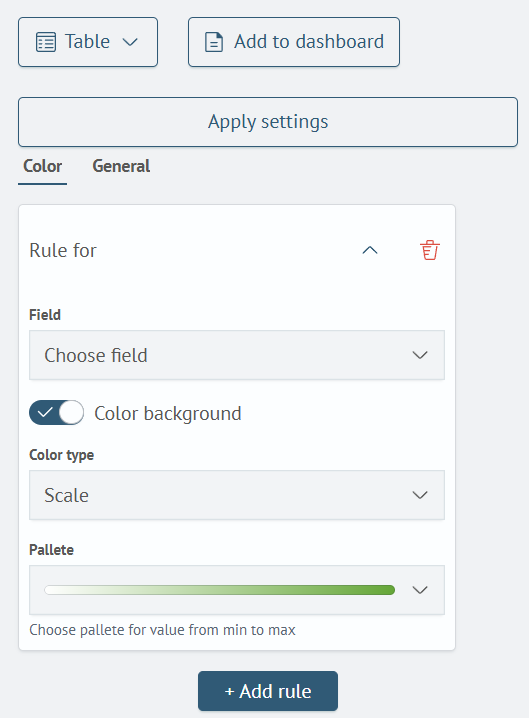
The Color tab allows configuring a color scheme for visualization. There are no default schemes in this tab. To add one, click the Add rule button. Schemes are configured for each column individually. Once a scheme block appears, it can be expanded by clicking the ᐯ button. Each scheme has the following parameters:
| Setting | Description | JSON-field |
|---|---|---|
| Color background | A toggle that enables or disables background color. | colorRuleList.isBackground |
| Field | A selection that allows choosing the field (column) to which the editable scheme will be applied. | colorRuleList.field |
| Color type | A scheme type selection. Available values: Palette, Color per value, Range. | colorRuleList.colorScheme |
Search Anywhere Framework color settings window:

Table creation
Query-based table creation
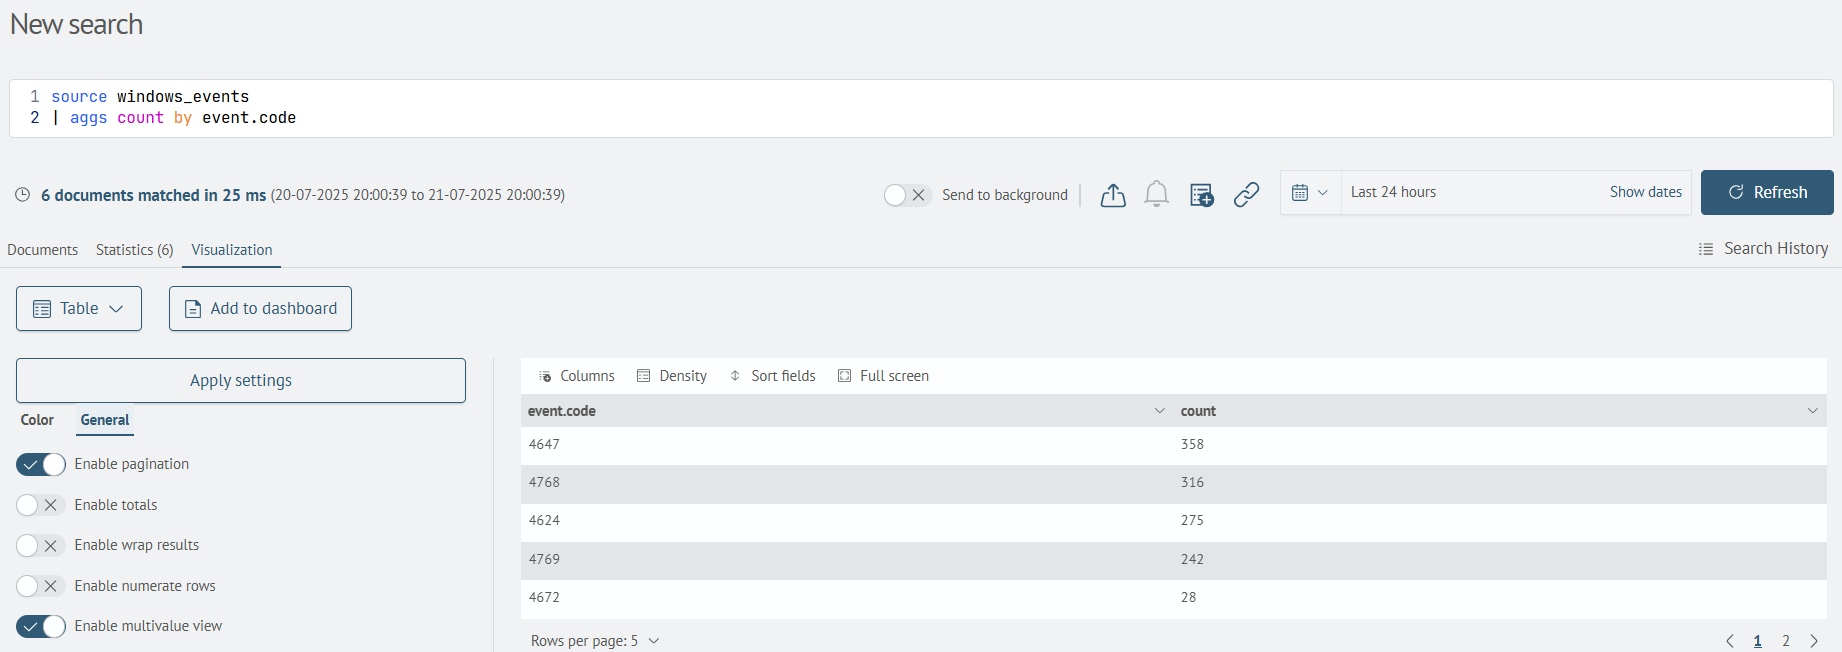
Table creation is enabled by applying statistical commands, such as: stats, aggs, and others. In this case, a table with corresponding statistics will be returned.
For example, the following search query:
source windows_events
| aggs count by event.code
Will return the result in the Statistics tab:

Upon switching to the adjacent Visualization tab, a table with data from the original tab will be displayed by default:

This visualization can then be directly added to a dashboard by clicking the corresponding button.
Table creation using the table command
Table creation is also possible using the dedicated table command table. This command is particularly useful when the query does not require a statistical response.
For example, the following search query:
source windows_events
Will return the result in the Documents tab:

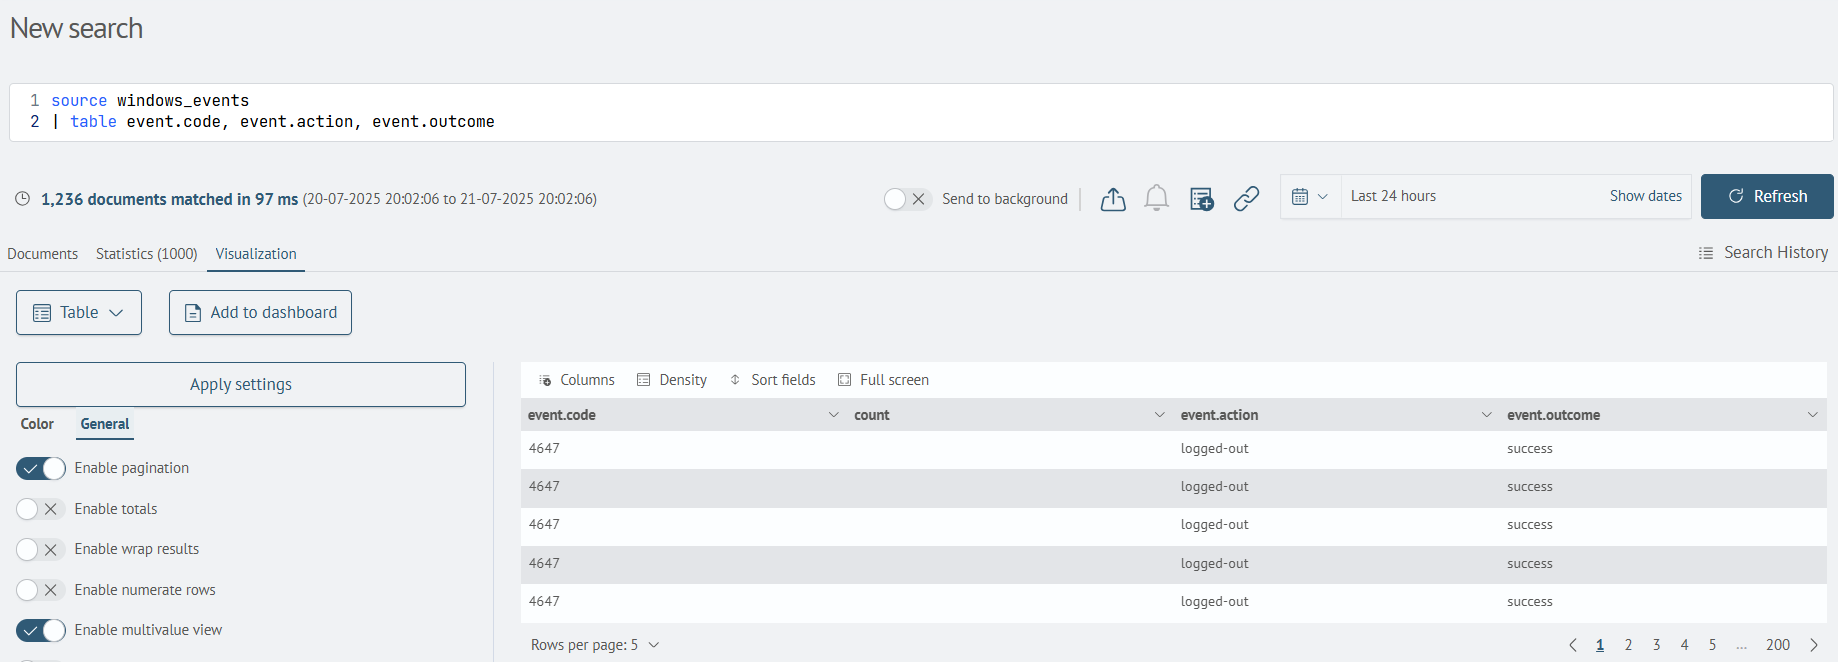
Switching to the Visualization tab will be disabled. However, modifying the query to the following will enable it:
source windows_events
| table event.code, event.action, event.outcome
The query will return results in the Statistics tab:

Once the query is executed, the Visualization tab will become available and display the table.
