Sankey Diagram
Overview
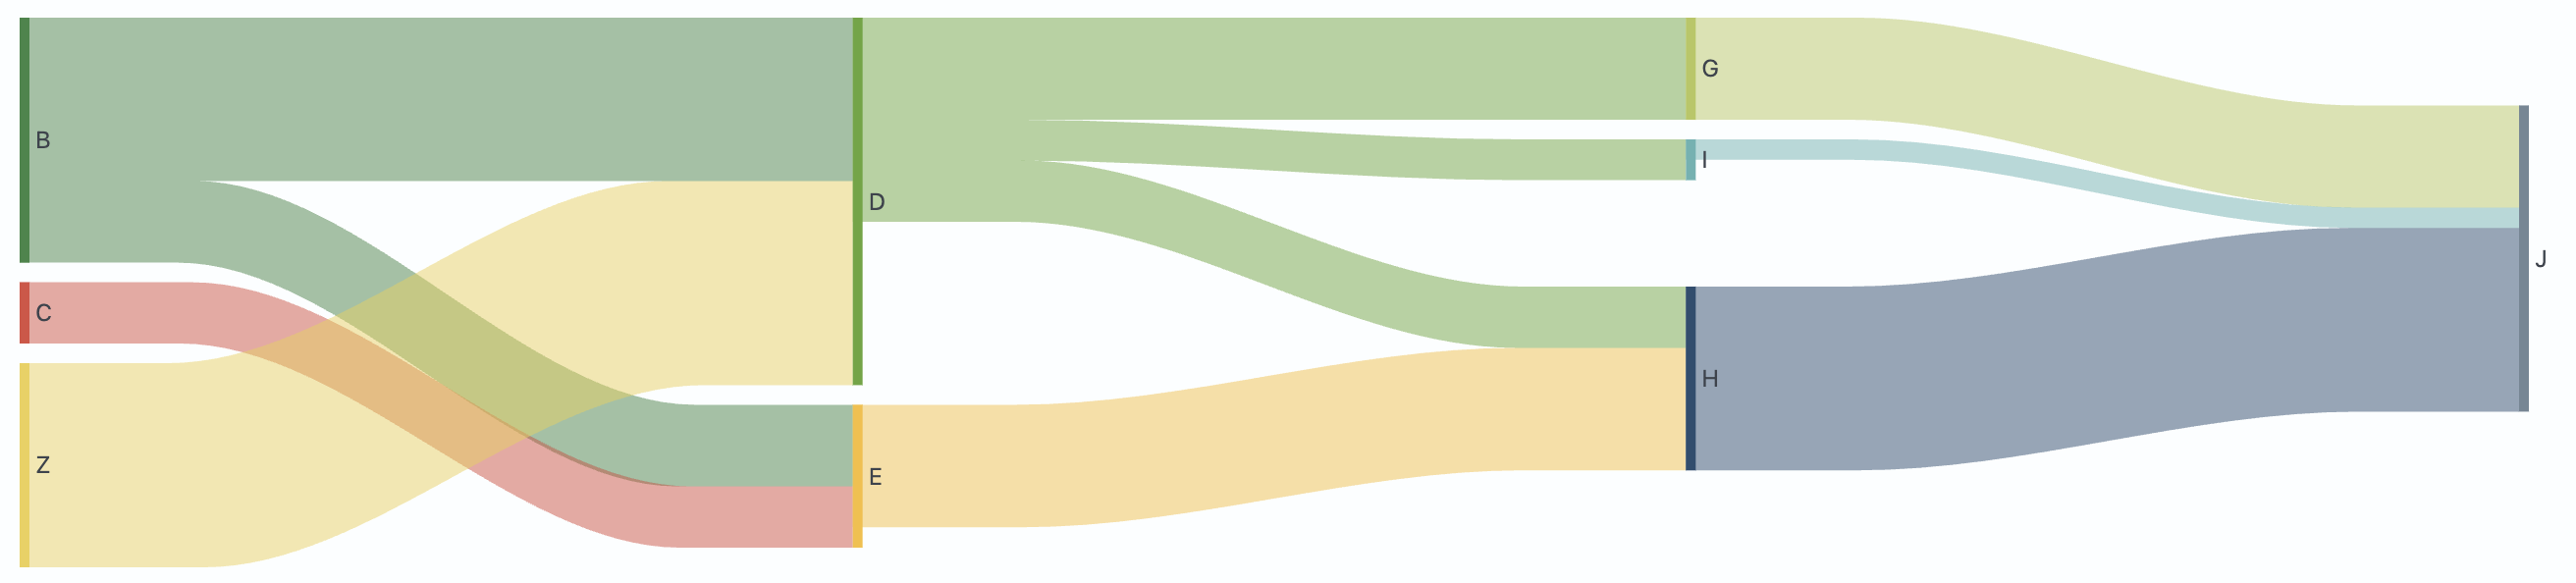 A Sankey diagram is a type of data visualization where information is represented as objects (nodes) connected by lines of varying widths. Sankey diagrams are commonly used to display business processes. They show key steps and the intensity of flow at each stage.
Sankey Settings
General
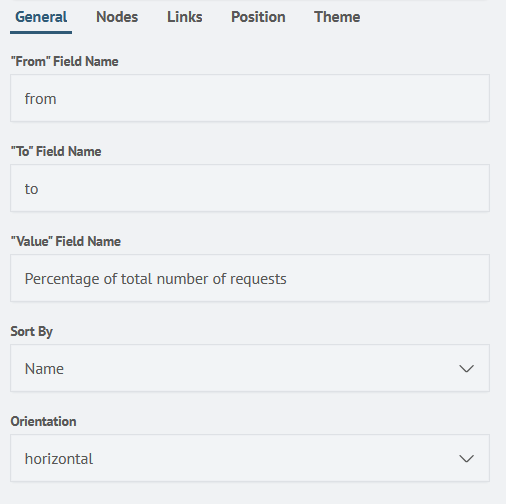
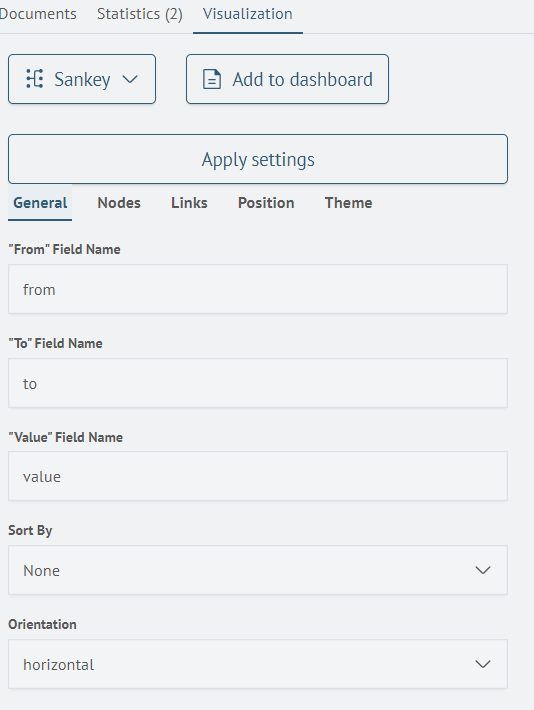
The General tab contains settings that allow you to configure the main parameters of the Sankey diagram.
| Parameter | Description | JSON Field |
|---|---|---|
| From Field Field | Text field to specify the field name that will display the source nodes. | general.fromFieldName |
| To Node Field | Text field to specify the field name that will display the target nodes. | general.toFieldName |
| Value Field Name | Text field to specify the field name that determines the width of the connection between nodes. | general.valueFieldName |
| Sort By | Selector to choose the sorting type for nodes. Three options are available: None, Name, Value. | general.sortBy |
| Orientation | The name of the field that determines the width of the connection between nodes. | general.orientation |
The settings interface in the SAF system looks like this:
Nodes
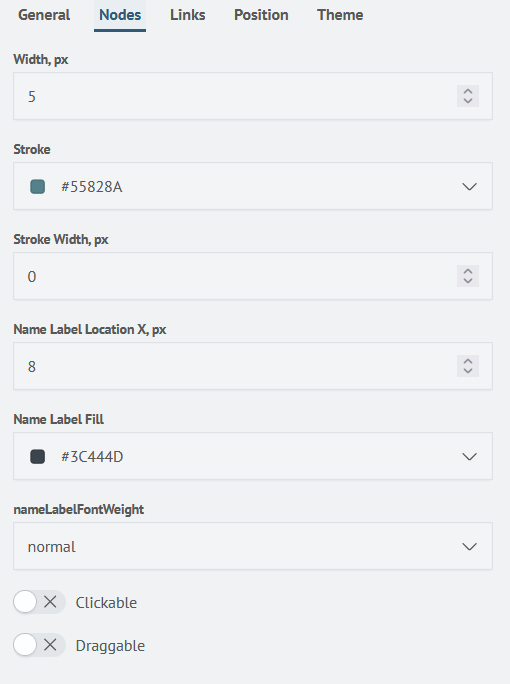
The Nodes tab contains the node display settings.
| Parameter | Description | JSON Field |
|---|---|---|
| Width, px | Text field to set the node width value. | nodes.width |
| Stroke Color | Color selector to choose the node outline color. Relevant when stroke width > 0. | nodes.stroke |
| Stroke Width, px | Number input field to set the node outline width. | nodes.strokeWidth |
| Label Offset, px | Number input field to set the offset of node labels relative to the nodes themselves. | nodes.nameLabelLocationX |
| Label Color | Color selector to choose the color of node labels. | nodes.nameLabelFill |
| Font Weight | Number input field to set the font weight of node labels. | nodes.nameLabelFontWeight |
| Clickable | Toggle switch to enable or disable hiding nodes by clicking on them. | nodes.clickable |
| Draggable | Toggle switch to enable or disable dragging nodes. | nodes.draggable |
The settings interface in the SAF system looks like this:
Links
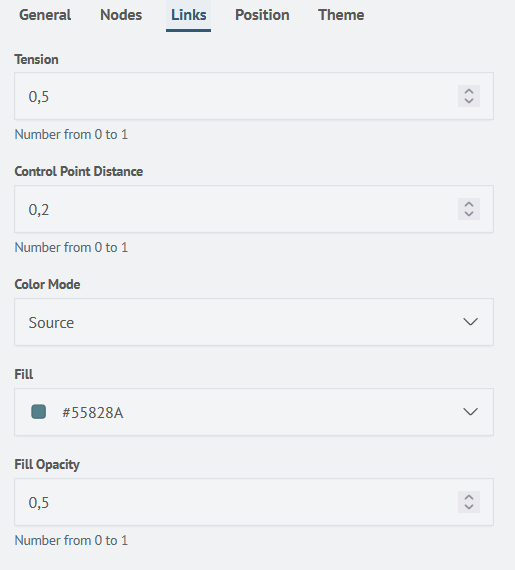
The Links tab contains the link display settings.
| Parameter | Description | JSON Field |
|---|---|---|
| Curvature | Number input field to set the curvature value of the links. | links.tension |
| Control Point | Number input field to set the distance of the straight part of the link to the bend of this link between two nodes. | links.controlPointDistance |
| Fill Mode | Selector to choose one of the fill modes. Available options: Source Node Color, Target Node Color, Solid Color, Gradient. | links.colorMode |
| Fill Color | Color selector to choose the link color. | links.fill |
| Fill Opacity | Number input field to set the link transparency. | links.fillOpacity |
The settings interface in the SAF system looks like this:
Position
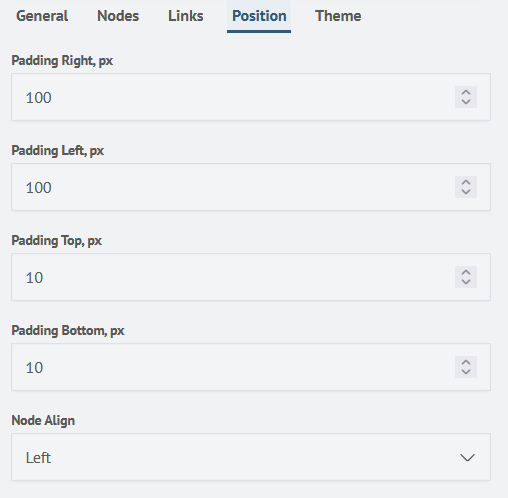
The Position tab contains the diagram position settings.
| Parameter | Description | JSON Field |
|---|---|---|
| Right Padding, px | Number input field to set the right padding of the diagram. | position.paddingRight |
| Left Padding, px | Number input field to set the left padding of the diagram. | position.paddingLeft |
| Top Padding, px | Number input field to set the top padding of the diagram. | position.paddingTop |
| Bottom Padding, px | Number input field to set the bottom padding of the diagram. | position.paddingBottom |
| Node Alignment | Toggle switch to select the diagram alignment. Available options: Left, Right, Center, Justify. | position.nodeAlign |
The settings interface in the SAF system looks like this:
Theme
In the Theme tab, you can choose one of the predefined color schemes. The default theme is "Smart Monitor". The general list of themes is shown below:
- Smart Monitor
- Material
- Dataviz
- Kelly's
- Frozen
- Moonrise Kingdom
- Spirited Away
- Amcharts
Creating a Sankey Diagram
Creating a Sankey diagram is possible with a query that returns a transition matrix between nodes with numerical transition values.
For example, the results of a query that returns data with suitable values:
source sankey-diagram-test1 | table from, to, value
Will return the following result:

After that, by switching to the Visualization tab, you can select the Sankey visualization type and add it to the desired dashboard by clicking the Add to Dashboard button.
After that, the diagram can be immediately used on the dashboard by clicking the Add to Dashboard button.