Radar Chart
Overview
A Radar Chart is a two-dimensional chart type that displays one or more groups of values on radial axes. Multiple variables are used to compare these values. Radar Charts are often used to compare several items across multiple criteria simultaneously.
Radar Chart Settings
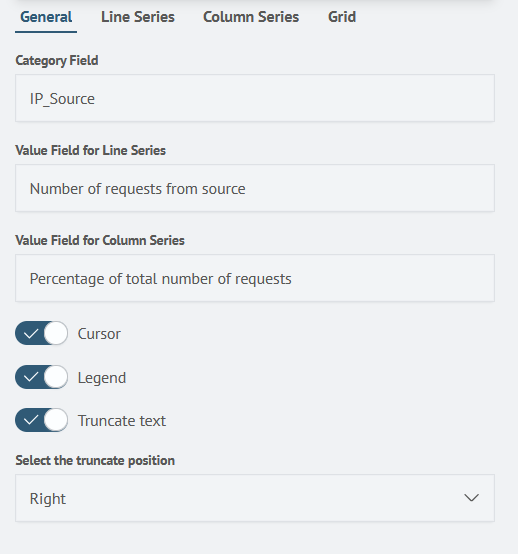
General
The General tab allows you to configure the following parameters:
| Parameter | Description | JSON Field |
|---|---|---|
| Category Field | Text field to specify the name of the field for the category. | general.categoryFieldName |
| Line Field | Text field to specify the name of the field for the line data. | general.valueLineSeriesFieldName |
| Column Field | Text field to specify the name of the field for the segment data. | general.valueColumnSeriesFieldName |
| Cursor | Toggle switch to enable/disable the cursor display. | general.cursor |
| Legend | Toggle switch to enable/disable the legend display. | general.legend |
| Truncate Text | Toggle switch to enable/disable text truncation. | general.truncateText |
These parameters appear as follows in the SAF interface:
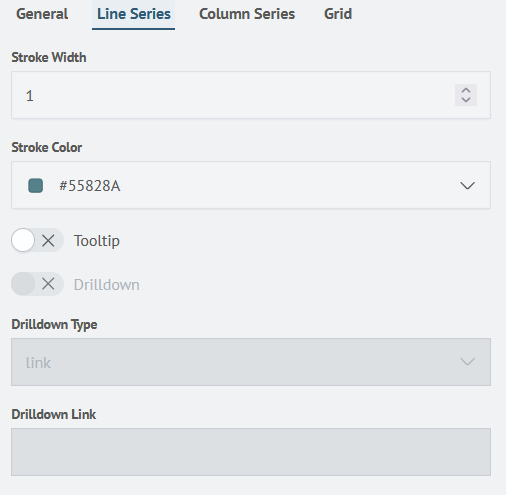
Lines
The Lines tab allows you to configure the following parameters:
| Parameter | Description | JSON Field |
|---|---|---|
| Stroke Width | Number input field to specify the line thickness | line.strokeWidth |
| Stroke Color | Color selector to choose the line color | line.strokeColor |
| Tooltip | Toggle switch to enable/disable the tooltip display when hovering over the line | line.tooltip |
| Drilldown | Toggle switch to enable/disable Drilldown | line.lineDrilldown |
| Drilldown Link | Text field to specify the Drilldown link | line.lineDrilldownText |
These parameters appear as follows in the SAF interface:
Segments
The Segments tab allows you to configure the following parameters:
| Parameter | Description | JSON Field |
|---|---|---|
| Fill | Color selector to choose the fill color of the segments | column.fill |
| Fill Opacity | Number input field to specify the opacity of the segments | column.fillOpacity |
| Tooltip | Toggle switch to enable/disable the tooltip display when hovering over the segments | column.tooltip |
These parameters appear as follows in the SAF interface:

Grid
The Grid tab allows you to configure the following parameters:
| Parameter | Description | JSON Field |
|---|---|---|
| Is Custom? | Toggle switch to enable/disable custom minimum and maximum settings for the grid | grid.isCustom |
| Min | Number input field to specify the minimum value for the grid | grid.min |
| Max | Number input field to specify the maximum value for the grid | grid.max |
These parameters appear as follows in the SAF interface:

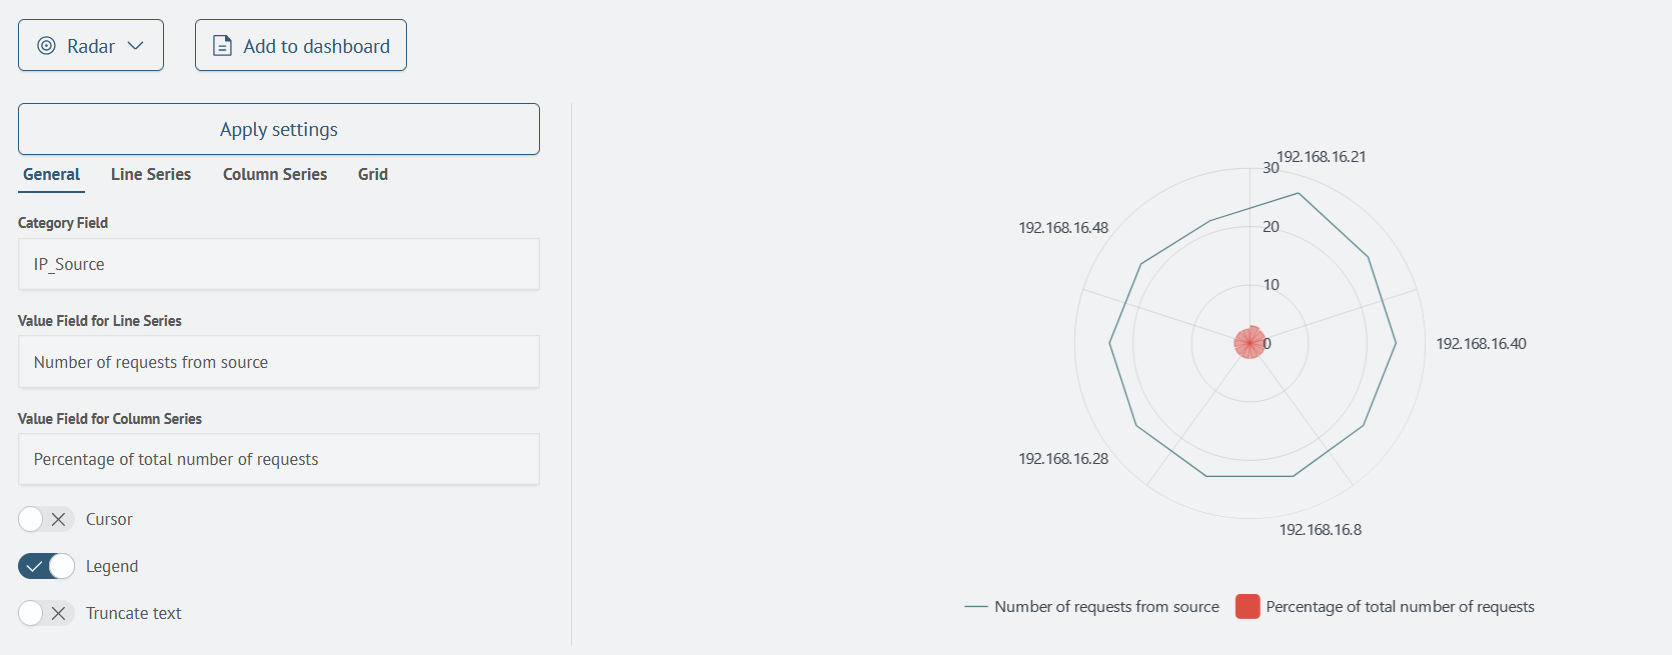
Creating a Radar Chart
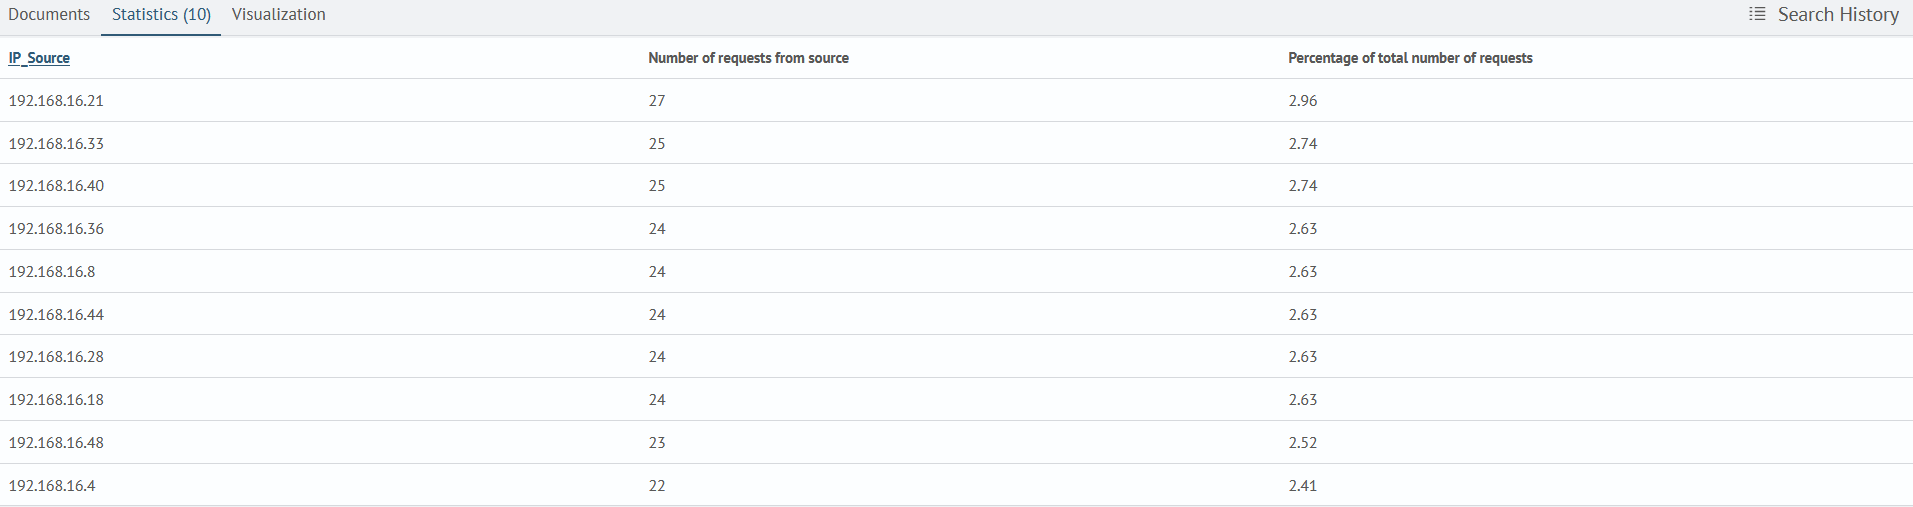
Creating a Radar Chart requires categories and two numerical value sets for the categories.
For example, the query:
source saf_cs_web_indexes
| stats count as count_by_ip by source.ip
| sort -count_by_ip
| eventstats sum(count_by_ip) as total_count
| head 10
| eval percent = round((count_by_ip / total_count * 100), 2)
| table source.ip, count_by_ip, percent
| rename source.ip as "Source IP", count_by_ip as "Number of requests from source", percent as "Percentage of total number of requests"
Will return the following result:
After that, by switching to the Visualization tab, you can select the Radar visualization type and add it to the desired dashboard by clicking the Add to Dashboard button.