Quick State
Overview
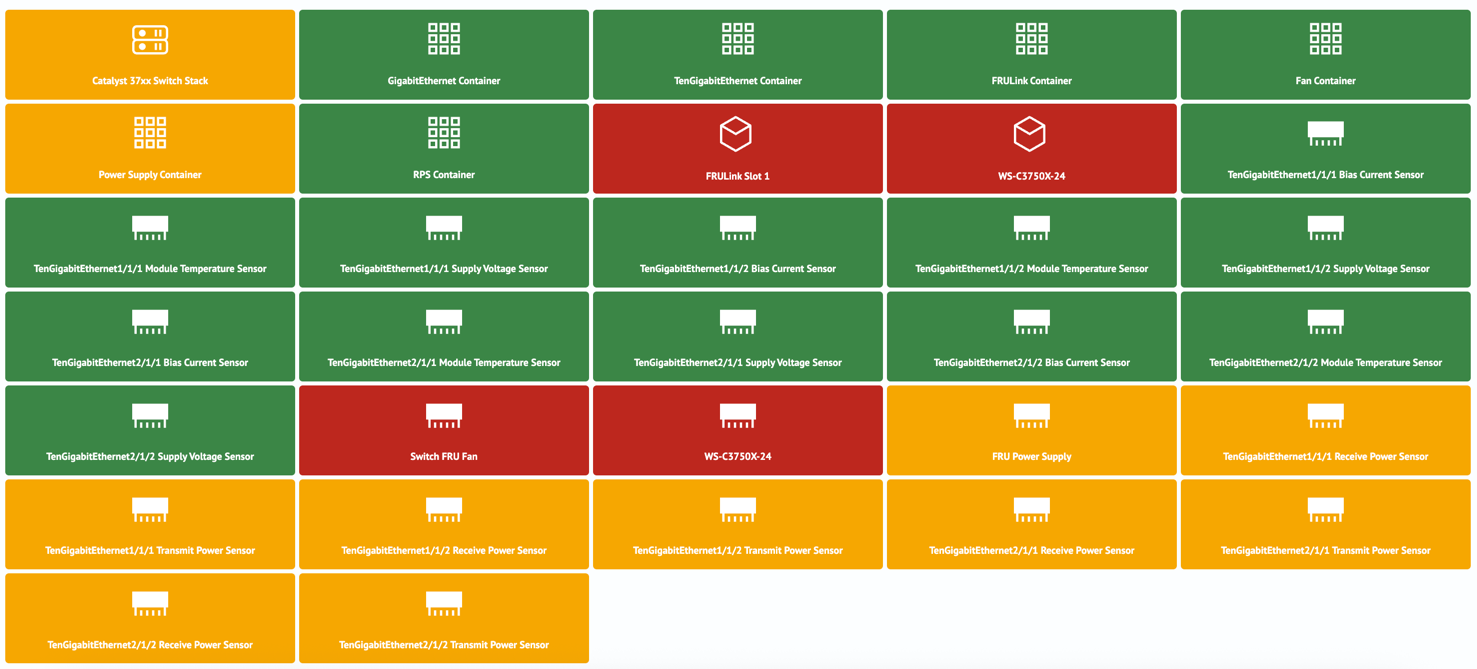 Quick State - is a type of data visualization represented as a group of cards displaying the state of objects. The visualization parameters (label, color, and icon) are determined based on values from the search query results.
Quick State Visualization Settings
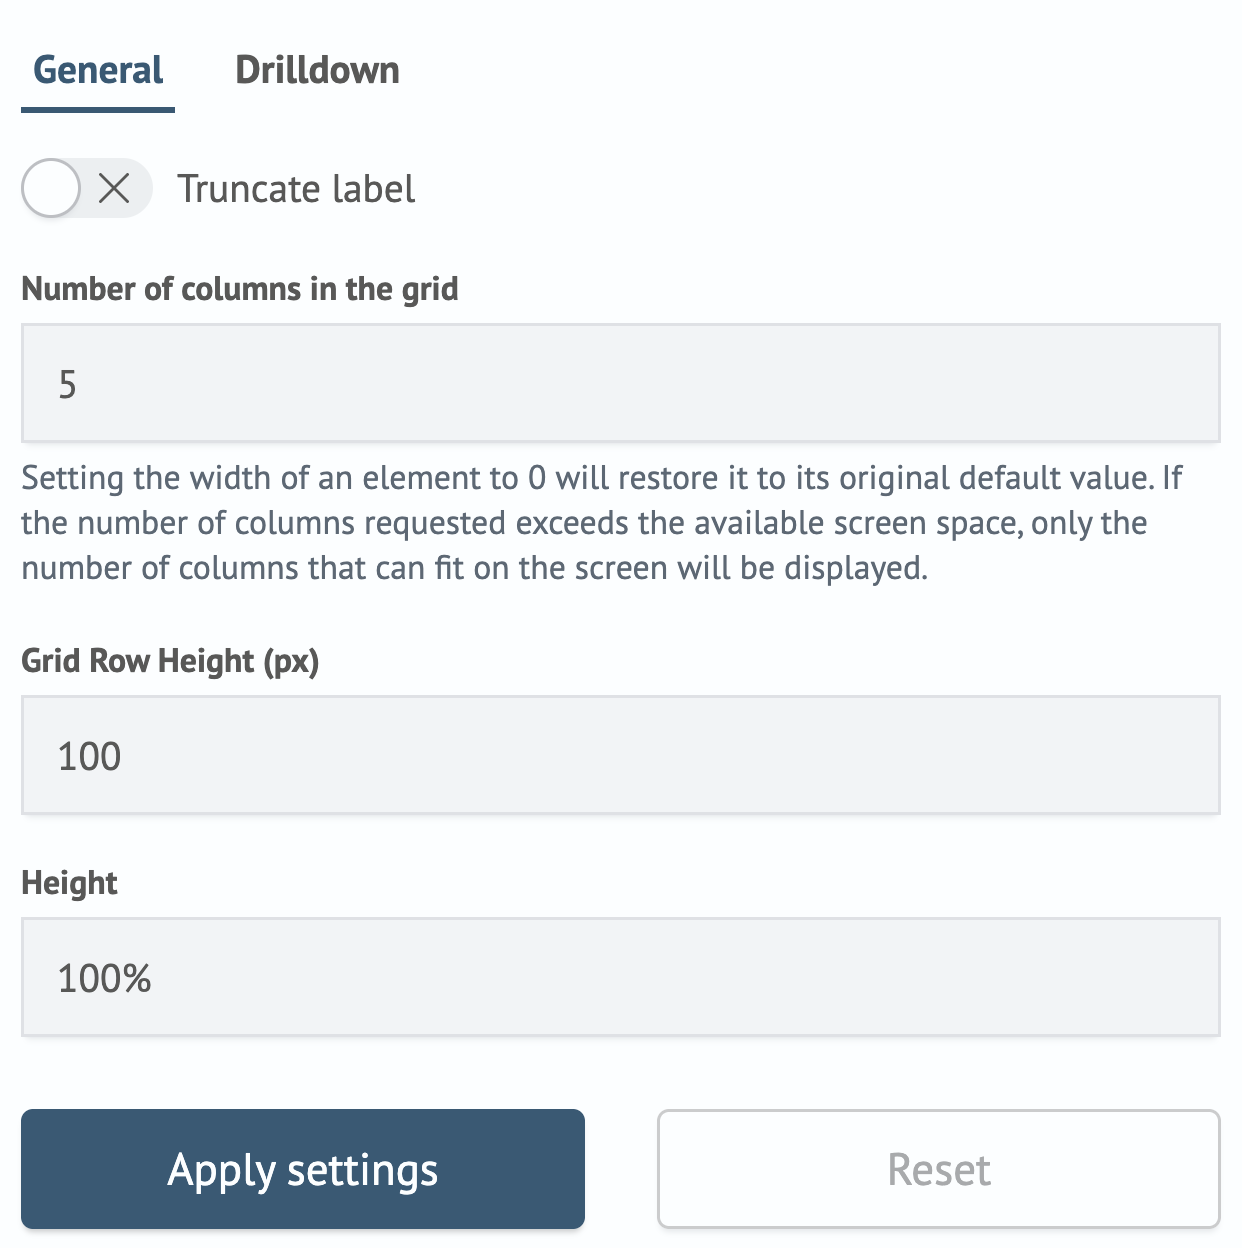
In the General tab, there are options to set the main parameters for the visualization layout.
| Parameter | Description | JSON Field |
|---|---|---|
| Truncate label | A toggle that allows truncating the label if it doesn't fit in the card | general.isTruncate |
| Number of columns in the grid | A numeric field to set the number of columns per row | general.columns |
| Grid Row Height (px) | A numeric field to set the height of the item | general.itemHeight |
| Height | A numeric field to set the height of the visualization container | height |
The settings interface in the Search Anywhere Framework system looks as follows:
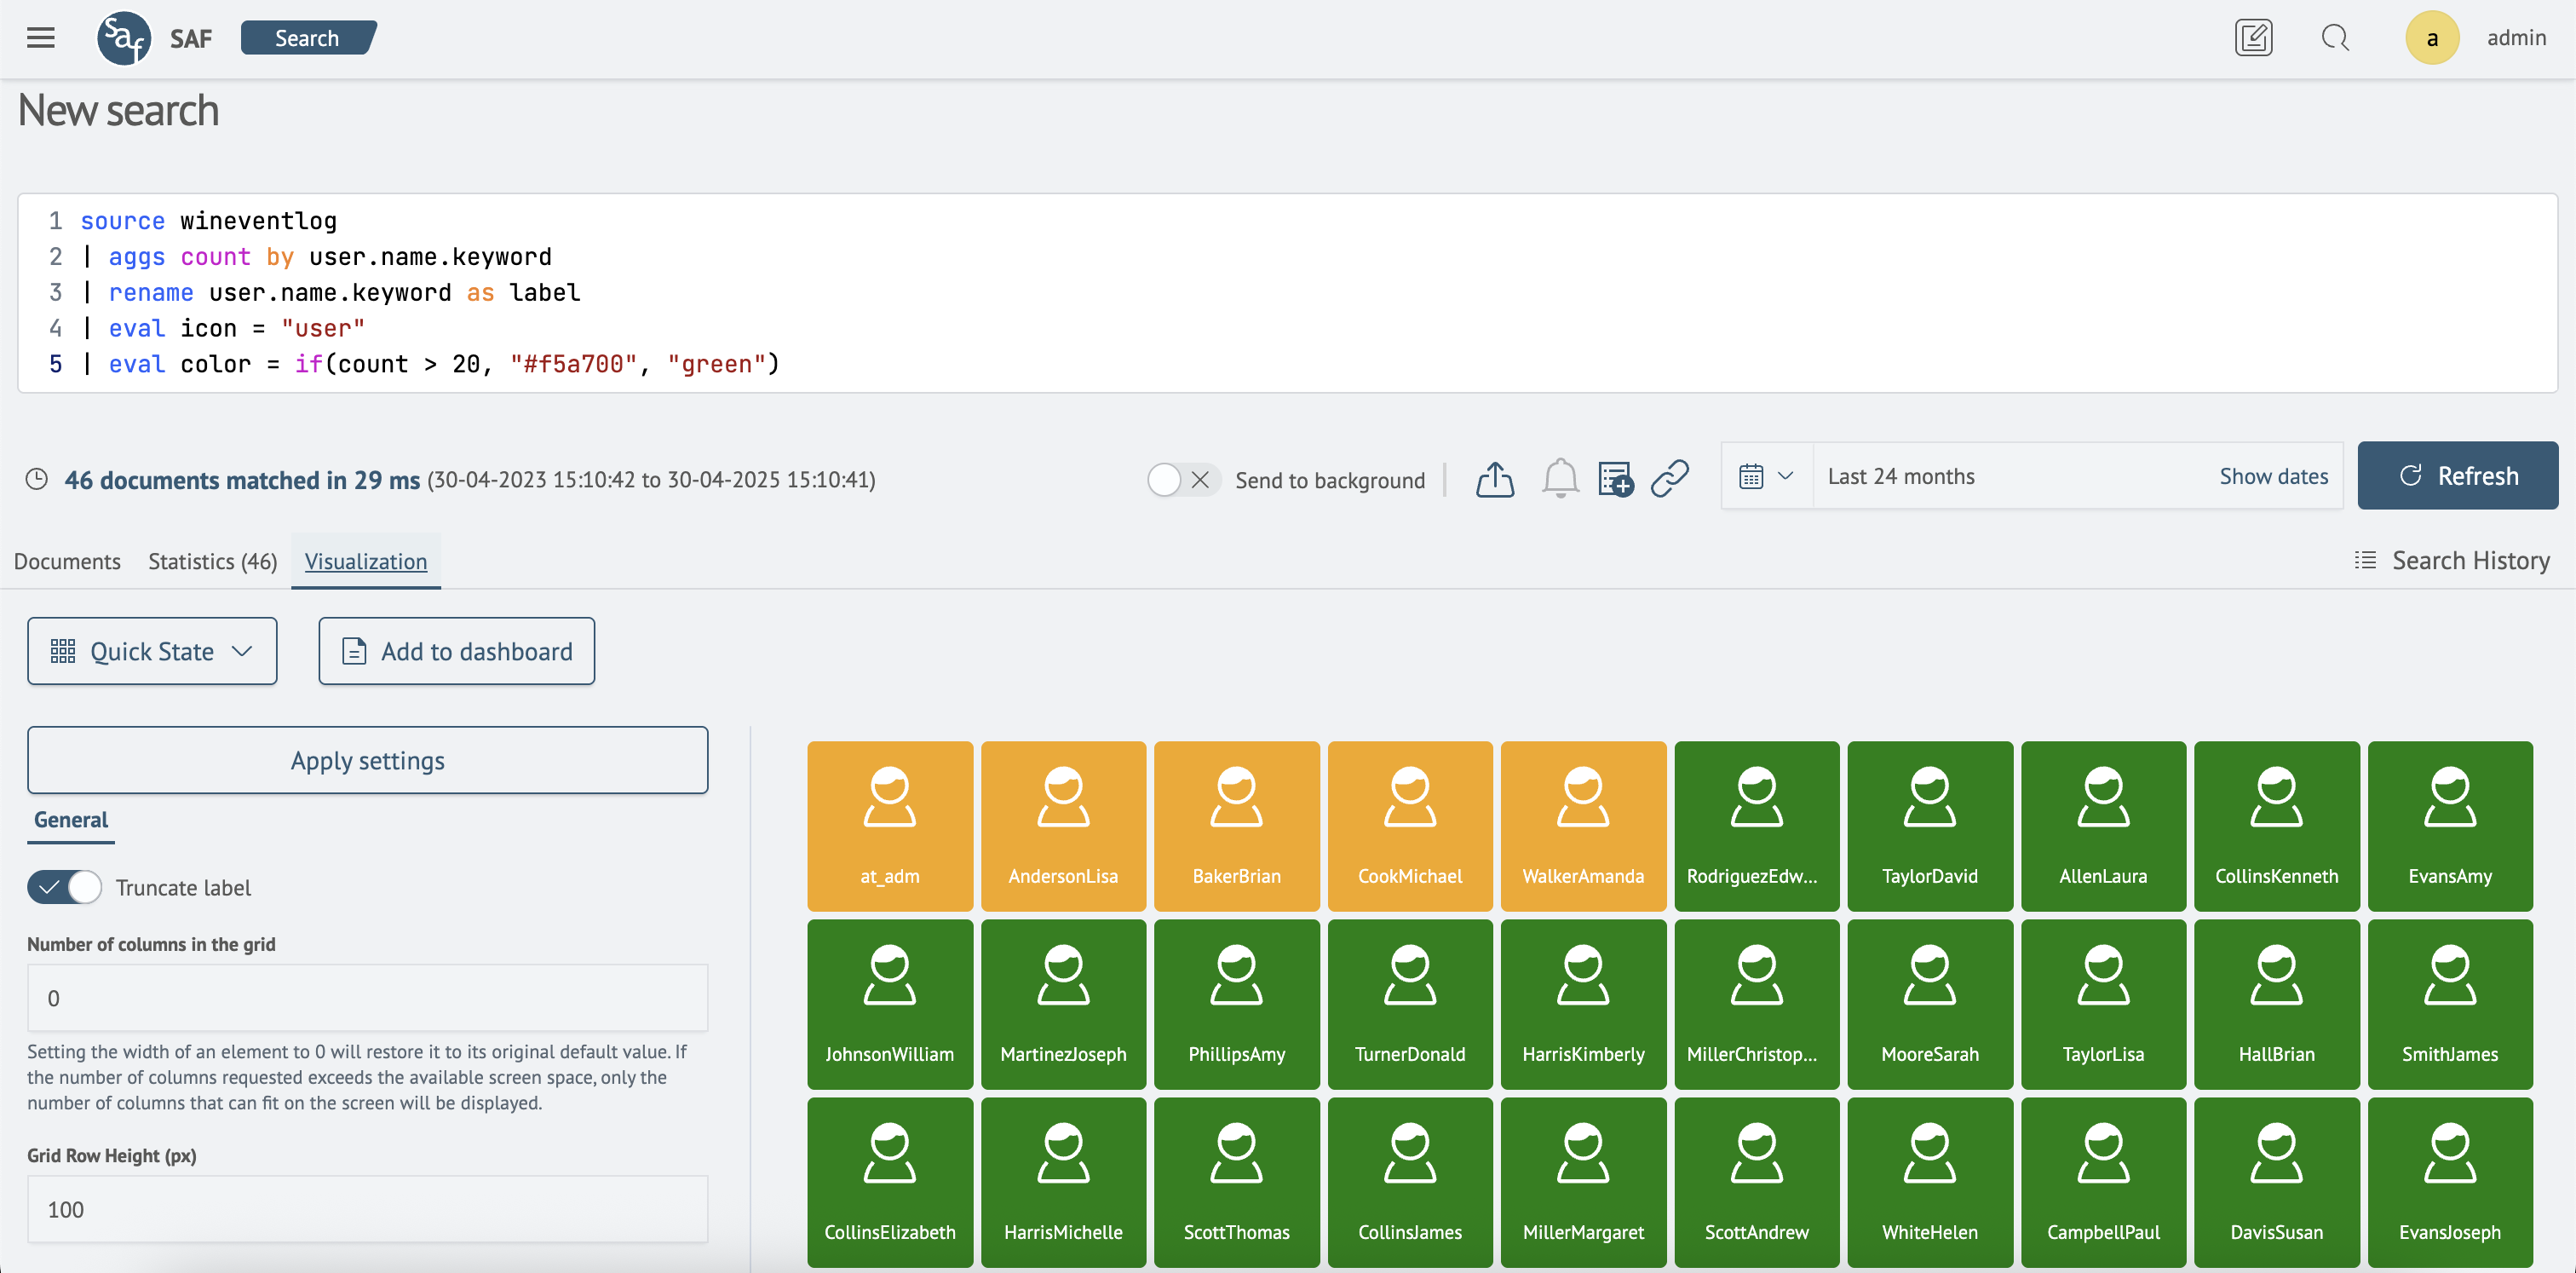
Creating a Quick State Visualization
The Quick State visualization works with three fields:
label- the card labelicon- the icon from the built-in set, displayed on the cardcolor- the card color, available inHEXformat or string color names such aswhite,green,red
If these fields are not present, the card will have a default icon of beaker, a color of primary, and the label will not be displayed.
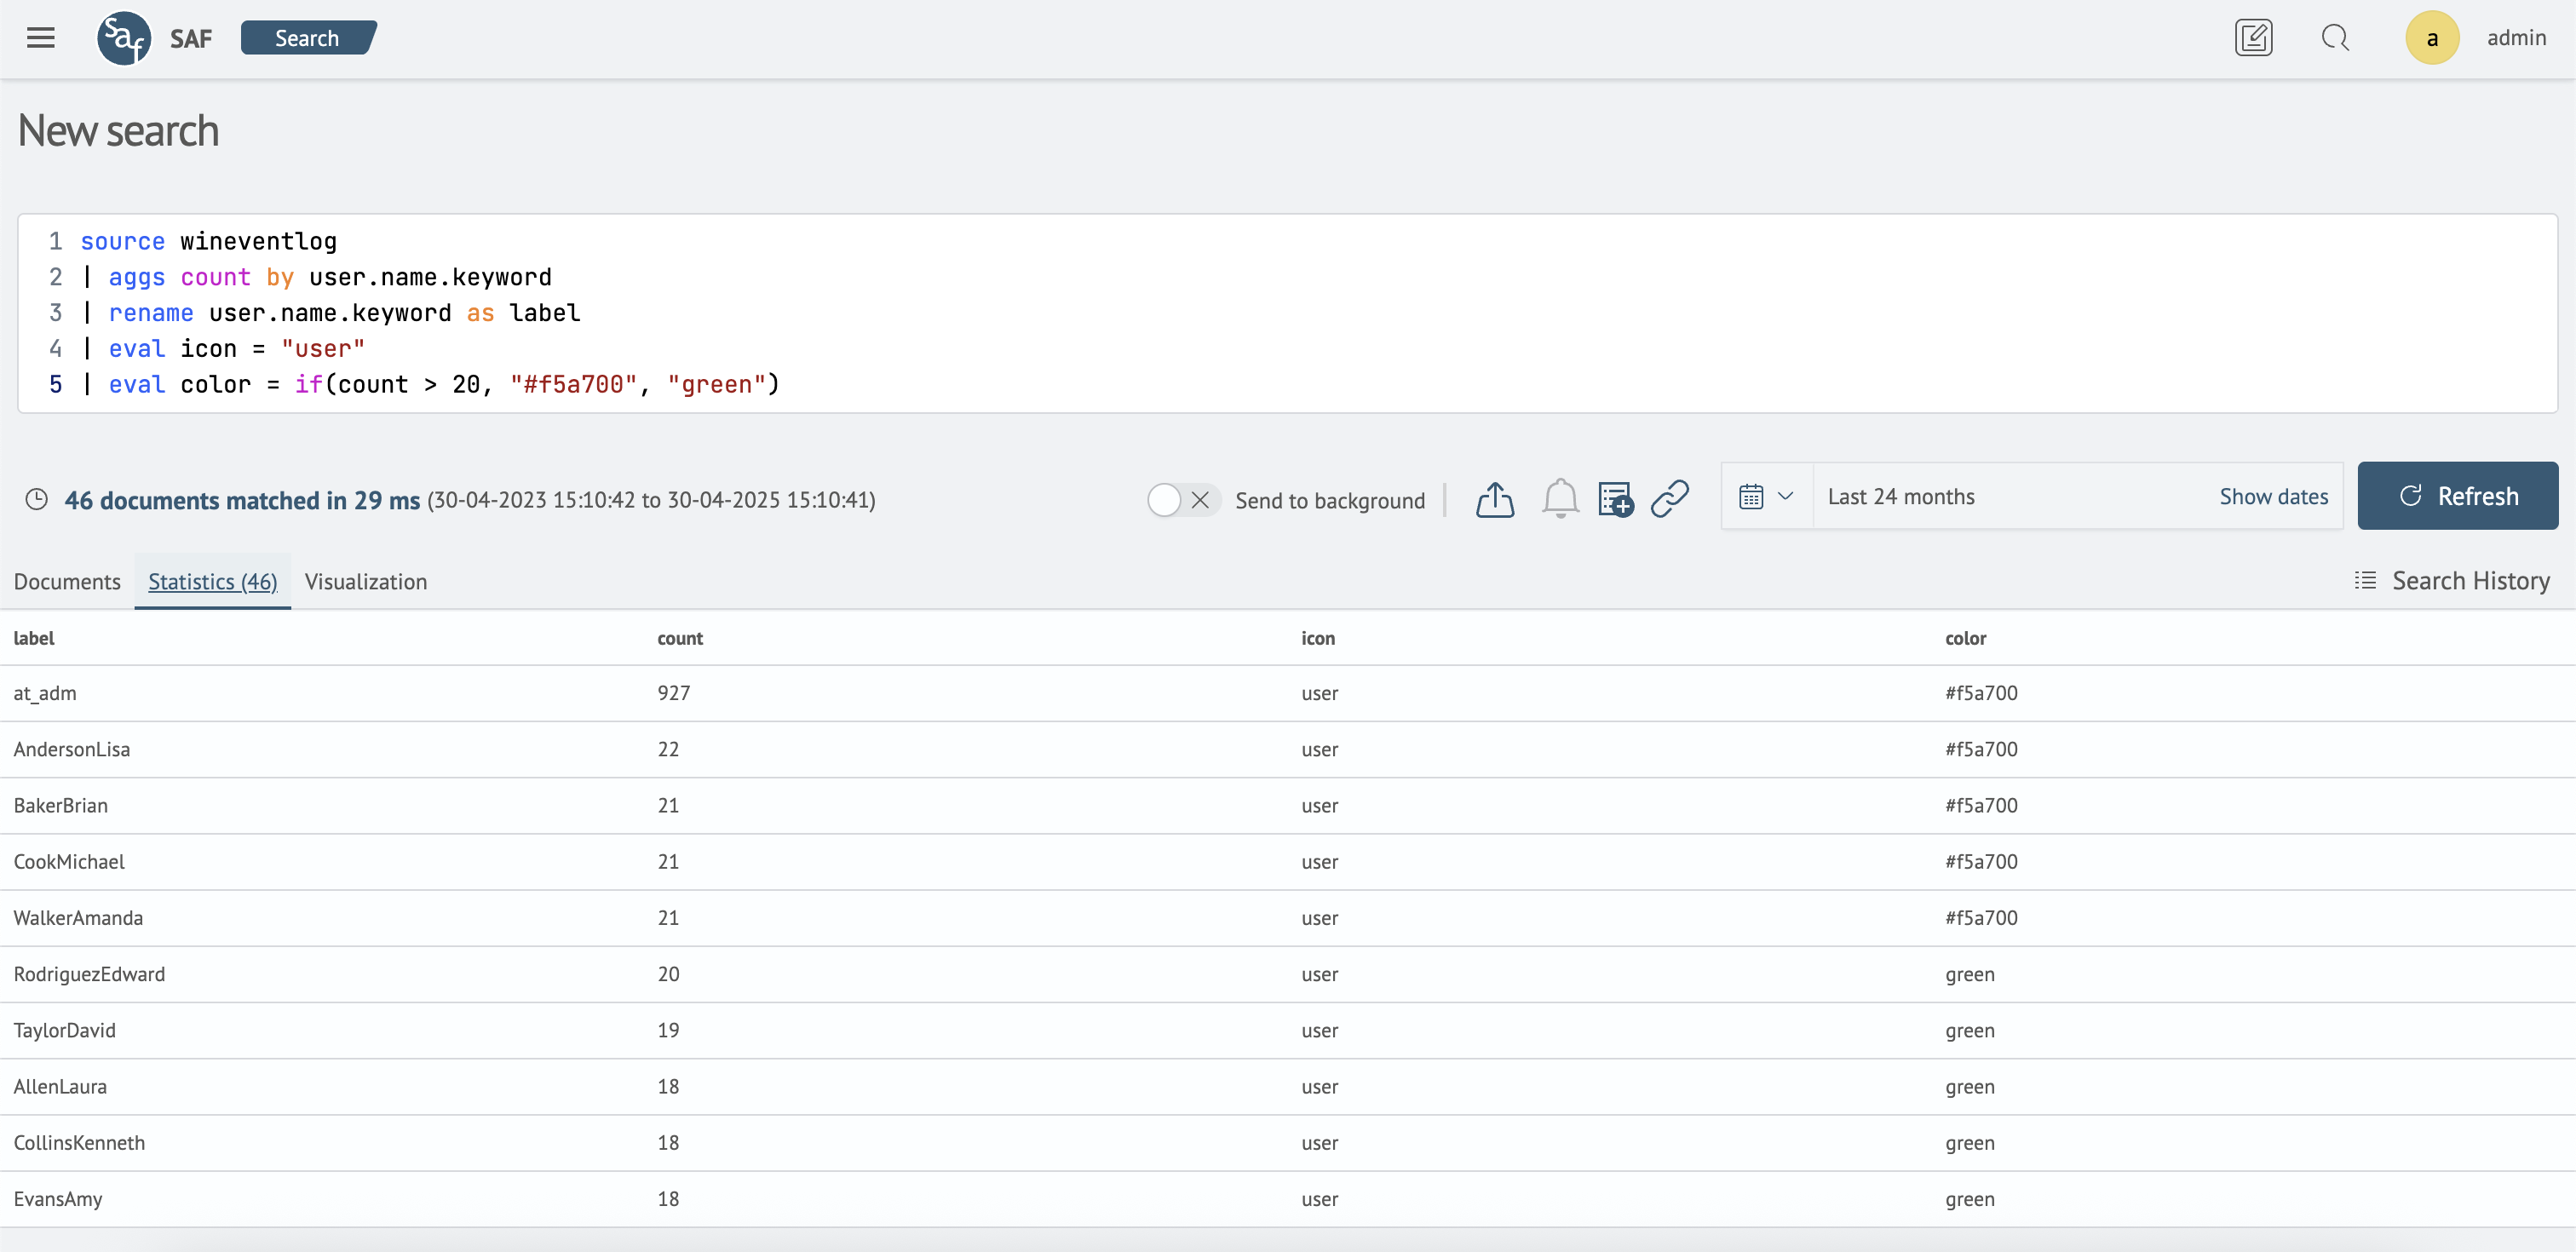
For example, the query:
source win_events
| aggs count by user.name.keyword
| rename user.name.keyword as label
| eval icon = "user"
| eval color = if(count > 100, "#f5a700", "green")
Will return the following result:
After that, go to the Visualization tab, select the Quick State visualization type, and add it to the desired dashboard by clicking the Add to dashboard button.