Map
Overview
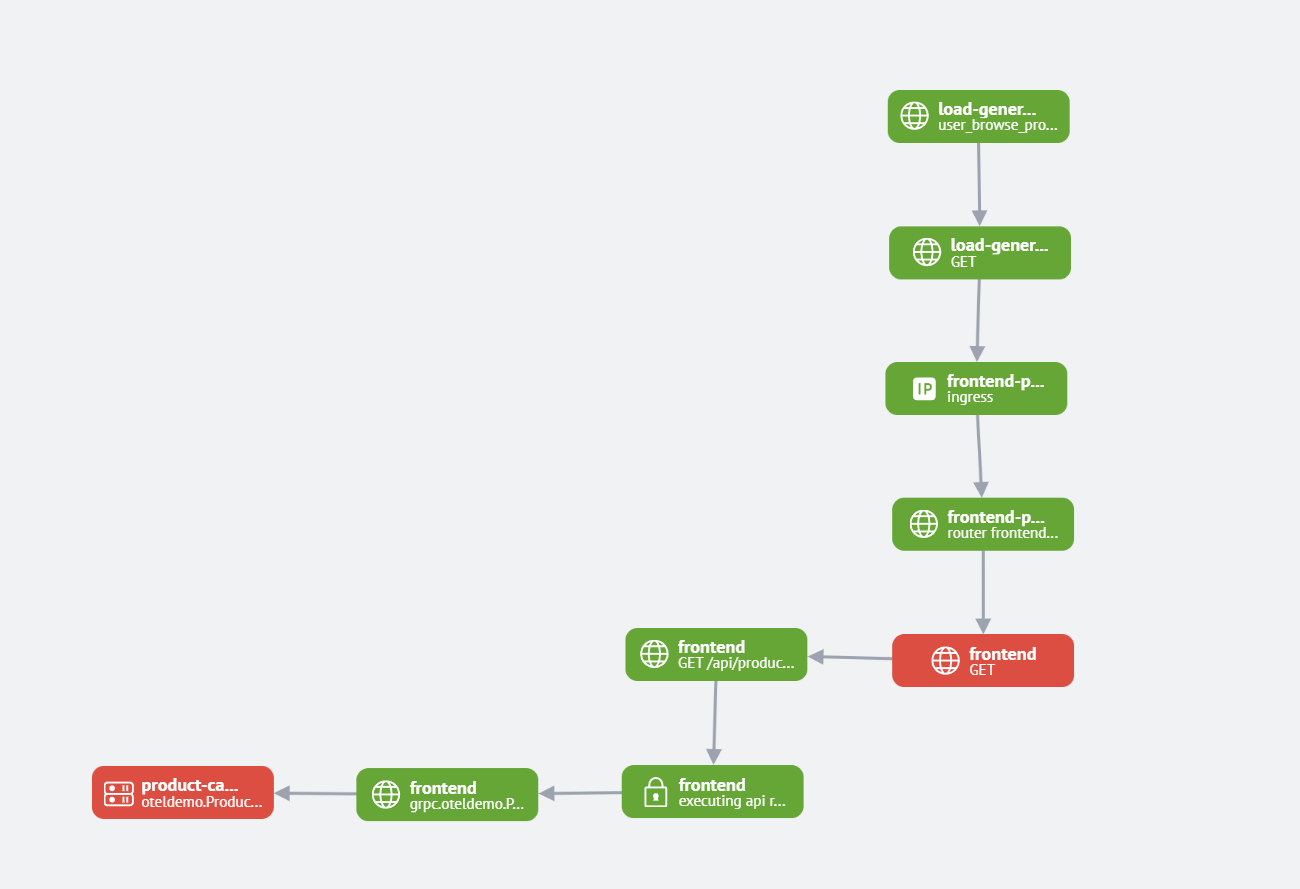
Map - is a visualization type that displays data as nodes (vertices) and connections between them (edges), representing complex relationships in a structured format.
Map Visualization Settings
In the current version, the Map visualization has no configurable settings.
Creating a Map Visualization
Map visualizations can be created when applying commands whose results can be represented as a table.
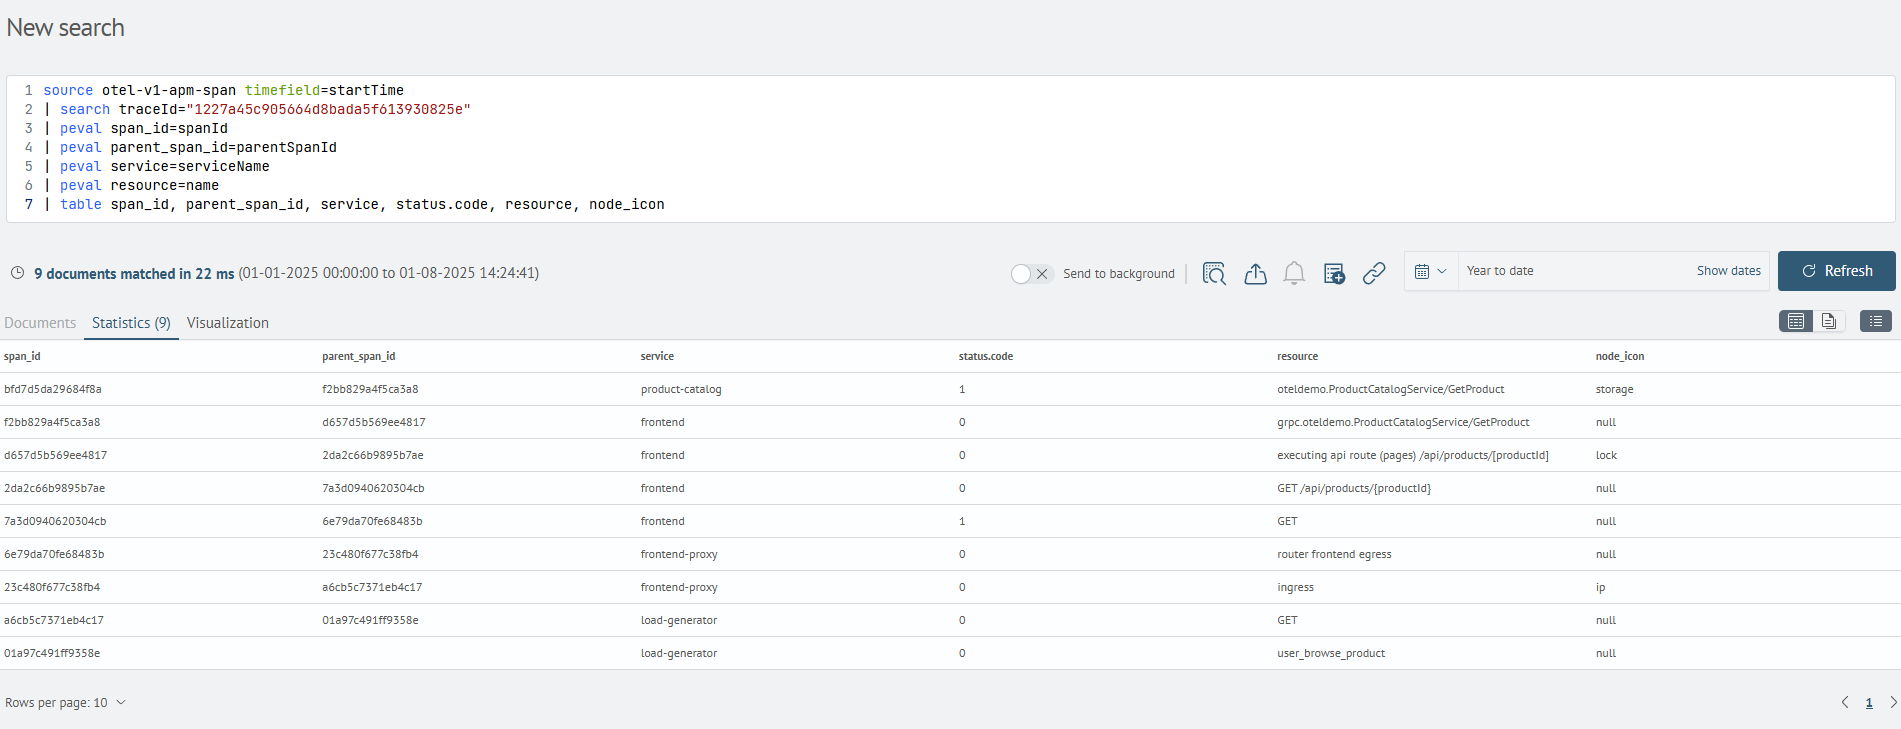
For example, the query:
source otel-v1-apm-span timefield=startTime
| search traceId="d2419f9ea2caf783a487eac88456d639"
| peval span_id=spanId
| peval parent_span_id=parentSpanId
| peval service=serviceName
| peval resource=name
| table span_id, parent_span_id, service, status.code, resource
Will return the following result:
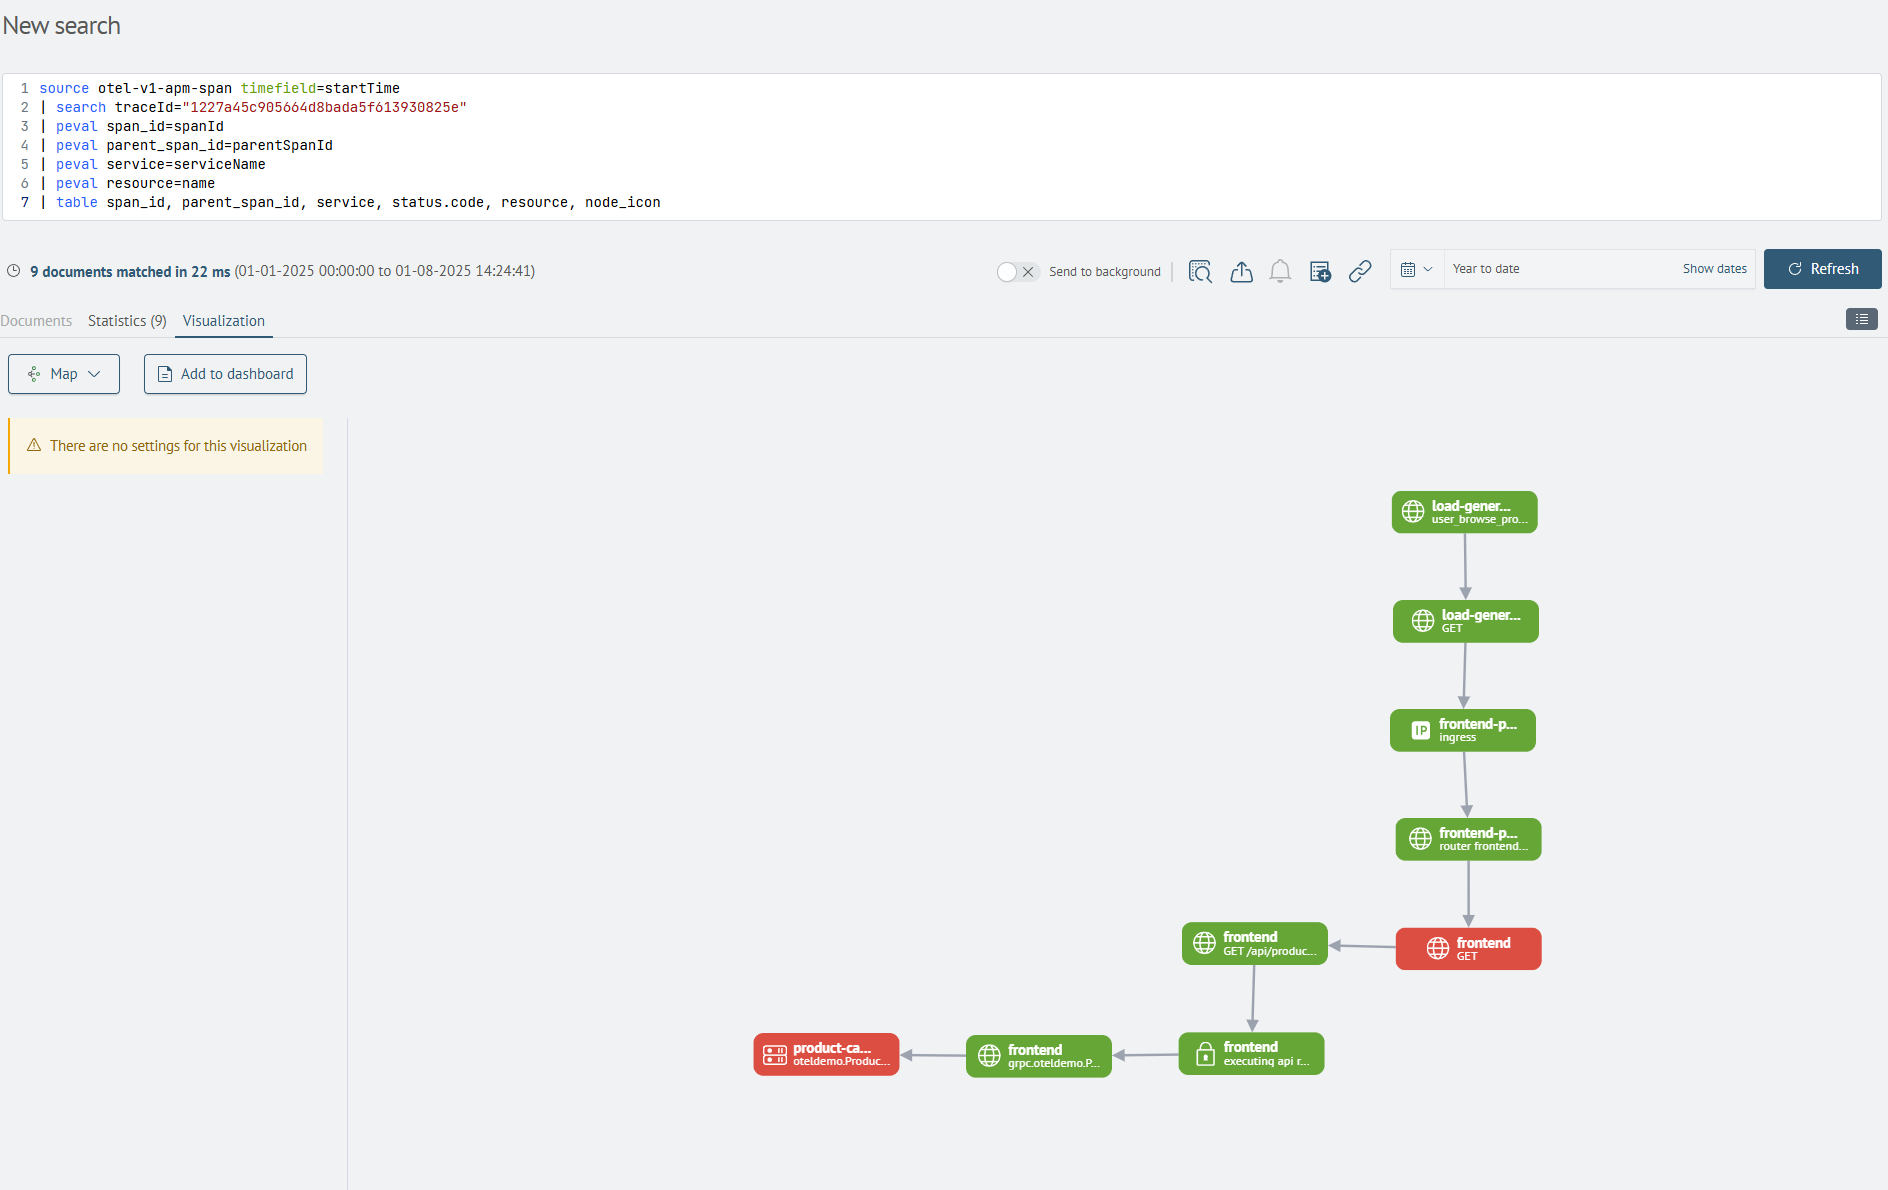
Afterwards, by navigating to the Visualization tab, you can select the Map visualization type and add it to the desired dashboard by clicking the Add to dashboard button.