HTML
Overview

HTML Visualization is a type of data visualization where information is presented based on a given HTML layout. In the editor it is possible to write HTML code in which it is possible to use tokens to access the received data, and in a separate style editor it is possible to design the layout appearance using CSS.
Settings
General
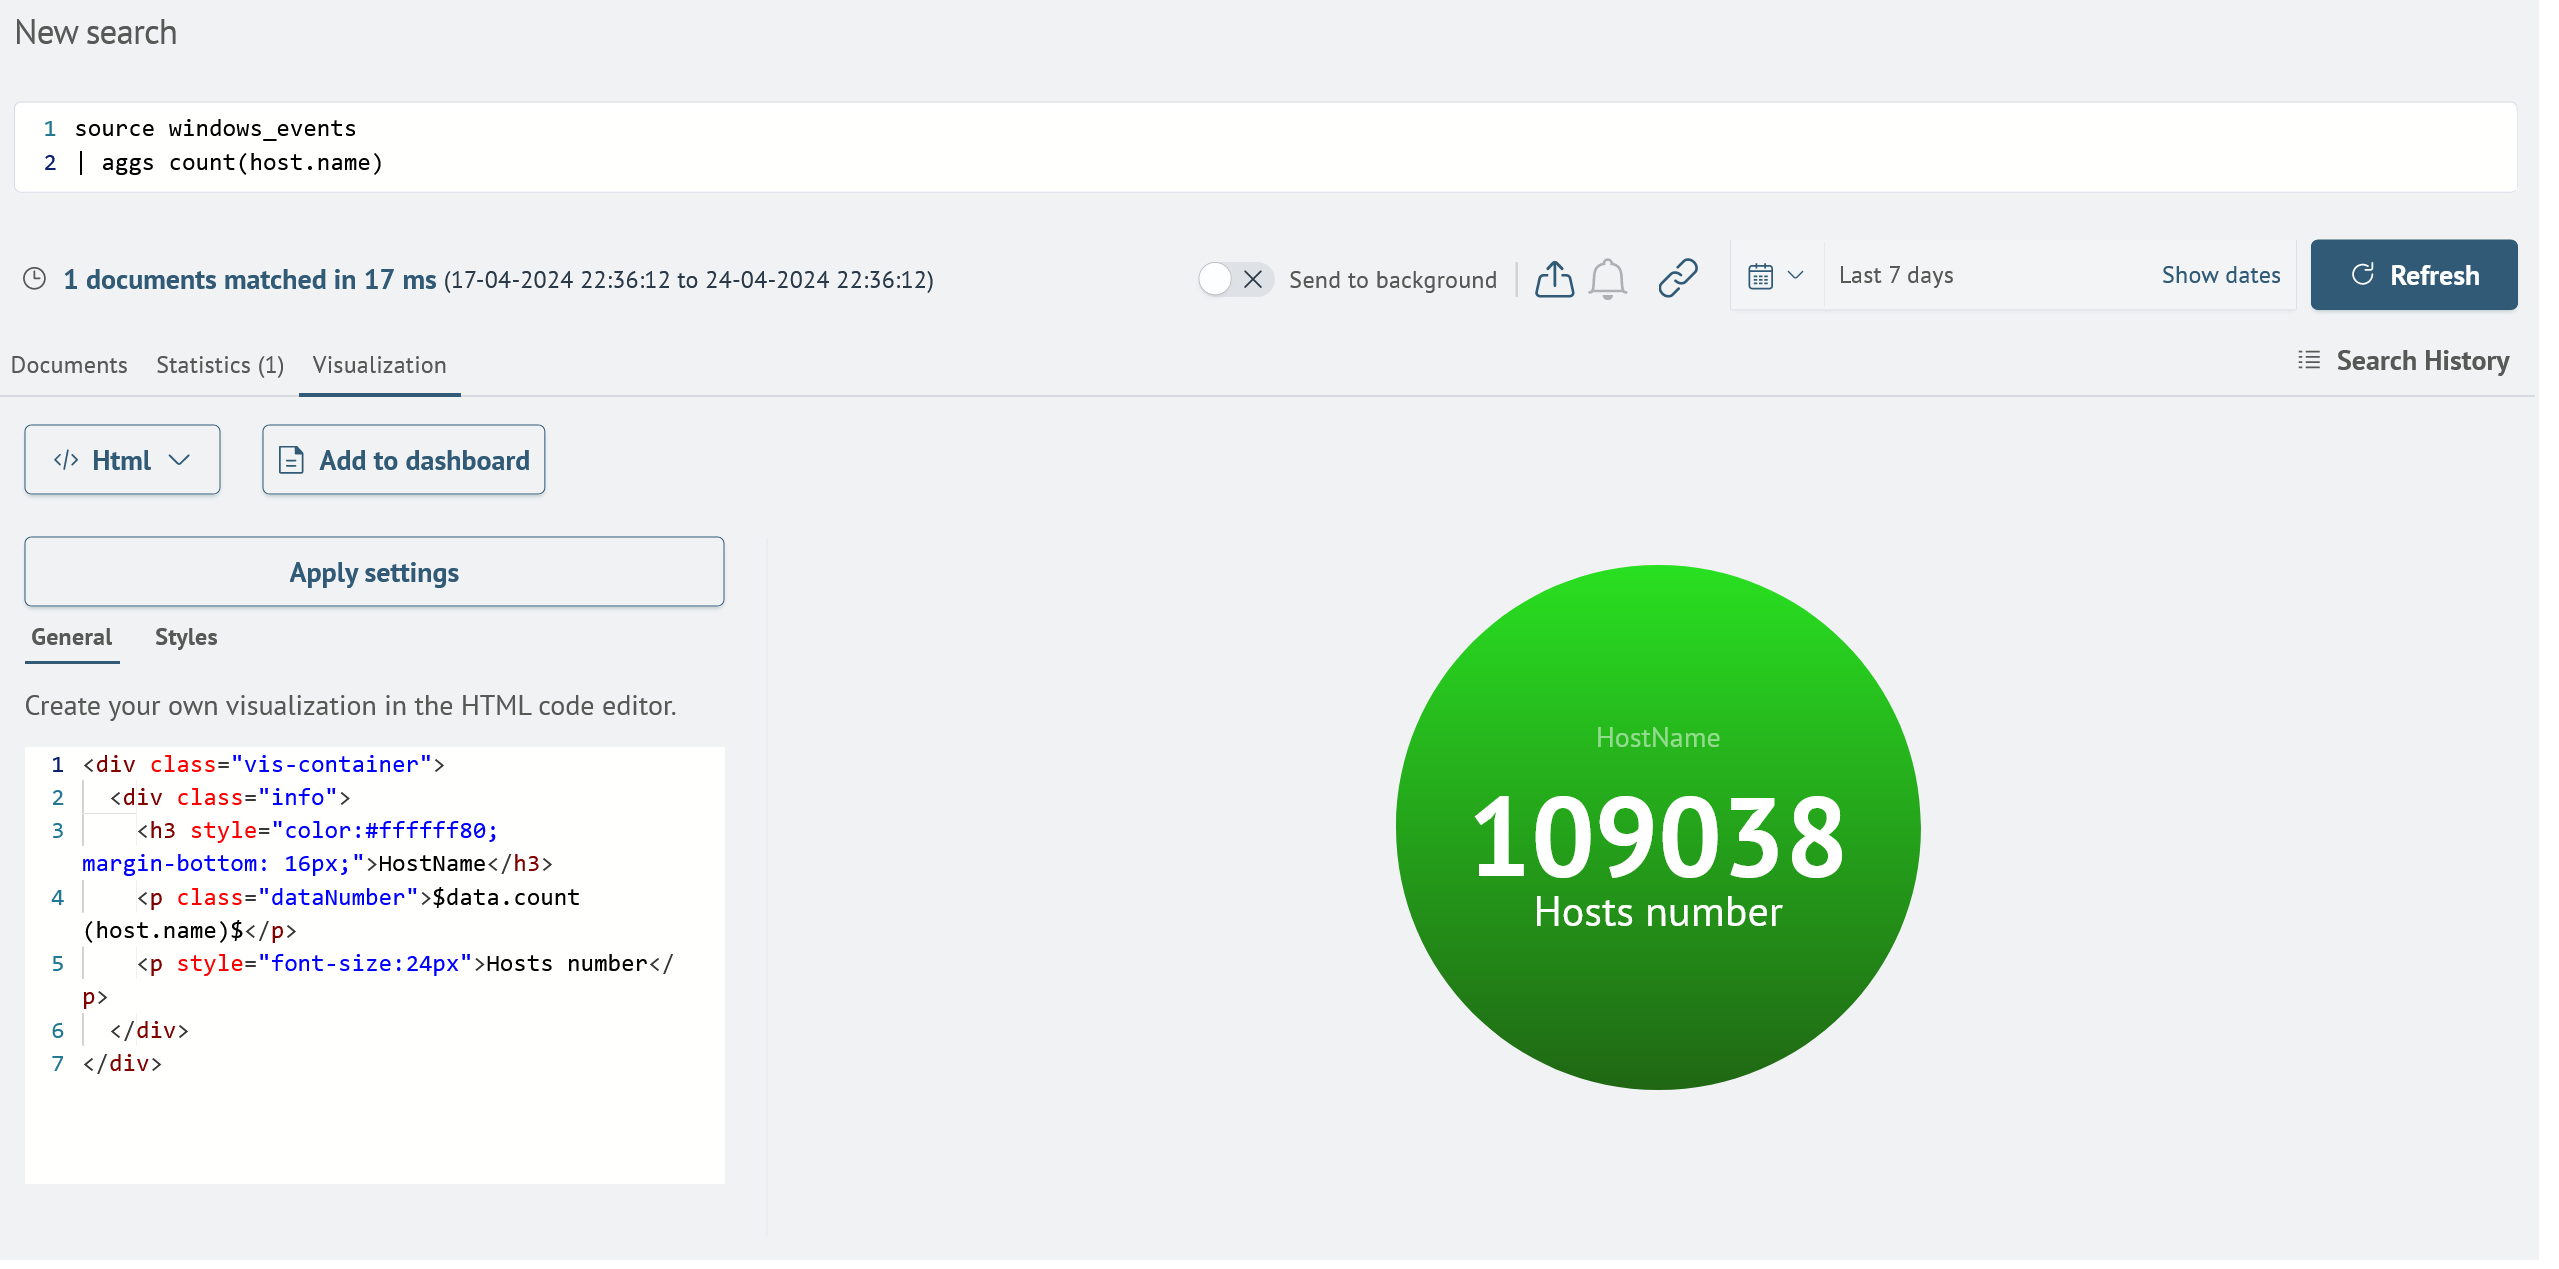
The General tab contains the HTML code editor. The layout specified in the HTML editor will be displayed in the panel with visualization. To display the query data in HTML, you must use tokens of the form $data.field_name$:
<div class="vis-container">
  <div class="info">
    <h3 style="color:#ffffff80; margin-bottom: 16px;">HostName</h3>
    <p class="dataNumber">$data.count(host.name)$</p>
    <p style="font-size:24px">Hosts number</p>
  </div>
</div>
Styles
The Styles tab contains the CSS code editor, which can be used to customize the appearance of elements created in the editor on the General tab:
.vis-container {
  margin: 16px auto;
  background: linear-gradient(0deg, rgba(32, 103, 20, 1) 0%, rgba(41, 224, 33, 1) 100%);
  padding: 32px;
  width: 300px;
  height: 300px;
  border-radius: 300px;
  display: flex;
  align-items: center;
  justify-content: center;
}

.info {
  text-align: center;
  color: white;
}

.dataNumber {
  font-size: 64px;
  font-weight: 700;
}
HTML Creation
Creation of HTML visualization is possible by applying statistical commands such as: stats, aggs or table.
If the query returns multiple rows of data, only the fields of the first row can be accessed.
For example, the query is:
source windows_events
| aggs count(host.name)
Will return the following result:

On the Visualization tab the HTML visualization setting is available. You can get the above query data in HTML code using the $data.count(host.name)$ token.

The visualization can then be used on the dashboard by clicking the Add to dashboard button.