Single Value
Overview
Single Value is a type of data visualization that focuses on displaying and emphasizing a single numeric value or metric. This approach to data visualization is particularly effective in situations where a specific metric needs to be presented quickly and clearly. Using a metric allows you to focus on one key indicator, minimizing noise and allowing users to quickly understand key trends or achievements.
One of the benefits of using a metric is its simplicity and clarity. Visualizing a single numeric value is usually done with a simple representation of the number and additional displays such as, a graph of the change in value, a trend, and a trend graph.
Settings Single Value
Settings
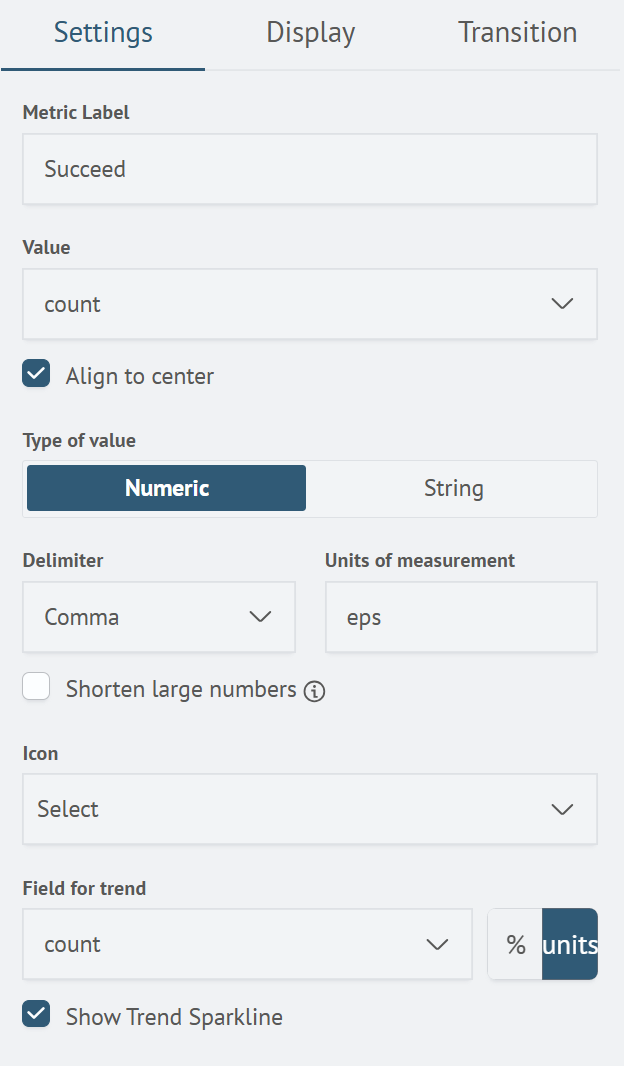
The Single Value has the following set of parameters in the Settings tab:
| Parameter | Description | JSON Field |
|---|---|---|
| Metric Label | Optional field for the metric name — the text displayed below the value. Dashboard token values can be substituted. | general.label |
| Value Field | Required field for the metric value to be displayed (a column from the query results). | general.fieldForValue |
| Align to center | Checkbox controlling column content alignment: when enabled, values are centered (default); when disabled, they are left-aligned. | general.isCentered |
| Type of Value | Toggle for selecting the type of value to display. Default is numeric. Affects field display: choosing the numeric type enables the Delimiter, Units of measurement, Shorten large numbers, parameters, as well as trend fields and the Show Trend option. The String option does not display a trend chart. | general.valueType |
| Delimiter | Allows selecting a thousands separator symbol for number formatting (period, space, or comma). For example, for the number 1234567 with a comma selected, the result will be 1,234,567. Works only for numeric values. | show.delimiter |
| Units of measurement | Allows entering units of measurement to be displayed next to the visualization name, separated by a middle dot (e.g. Name • pcs). Works only for numeric values | show.suffix |
| Shorten Large Numbers | Converts large numbers into a more readable format with abbreviated units (e.g., 1500 → «1.5 K», 2000000 → «2 M»). Works only for numeric values | general.shortenBigNumbers |
| Icon | Allows adding an icon before the main value of the visualization. | icon |
| Field for trend | Optional field responsible for displaying the metric's change trend. | general.fieldForTrend |
| Trend Units Selection Field | ОDefines the units for displaying the trend — as a percentage or in absolute units. | general.trendUnit |
| Show Trend Sparkline | Enables or disables the display of the trend chart for the visualization. Works only for numeric values | show.sparkline |
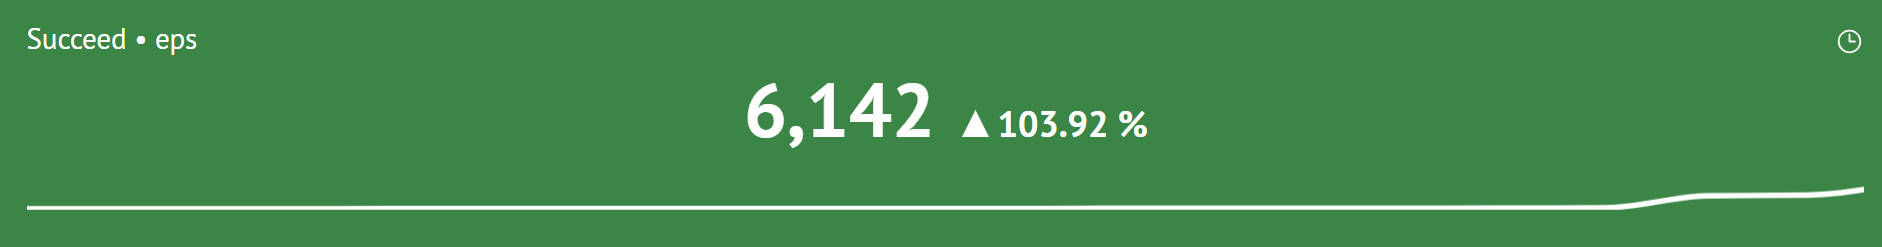
These parameters are applied to the visualization as follows:
- Metric Label (
label) - Units of measurement (
suffix) - Trend Indicator (depends on
fieldForTrend,trendUnit) - Icon — image before the value (
icon) - Trend — displayed chart (depends on
valueTypeandsparkline) - Main Value (
fieldForValue) - Delimiter (
delimiter) - Abbreviated suffix for large number conversion (
shortenBigNumbers)
Show
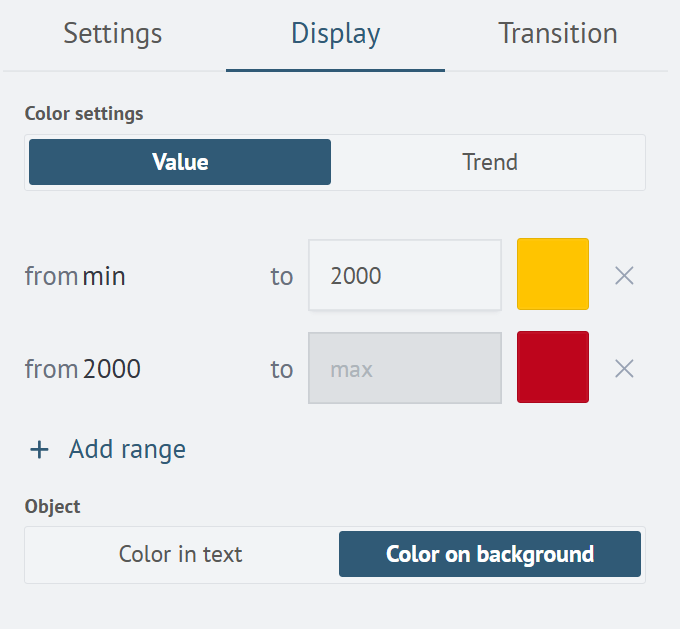
The Single Value has the following set of parameters in the Display tab::
| Parameter | Description | JSON Field |
|---|---|---|
| Color Settings | Allows selecting what the color settings apply to — the Value or the Trend. | color.isRange |
| Color Palette Settings Field | Allows defining a set of color rules — by ranges for numeric values or by specific values for strings. Works only in Value mode | color.color |
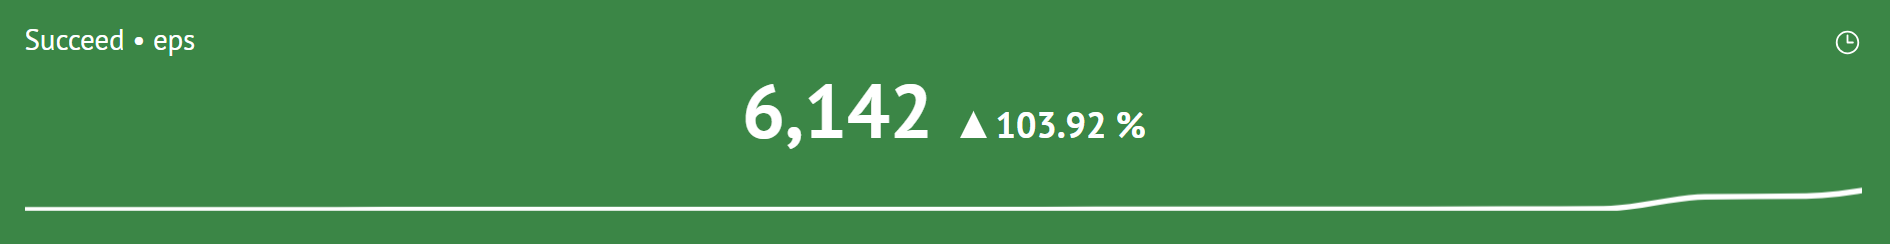
| Target | Defines what the color is applied to when a condition is met: the background or the value. Works only in Value mode | color.invert |
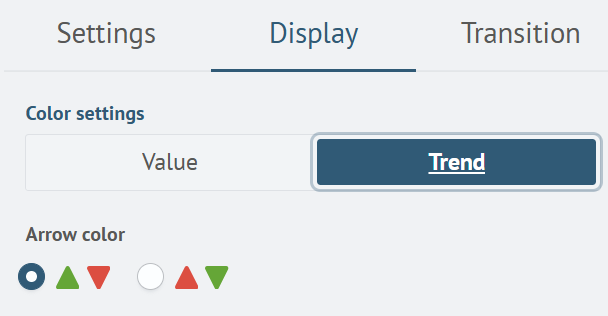
| Direction Color | Defines the color scheme for trend indicators. The classic palette is applied by default. The reversed trend palette works only in Trend mode. | color.indicatorColor |
Display in Value Mode
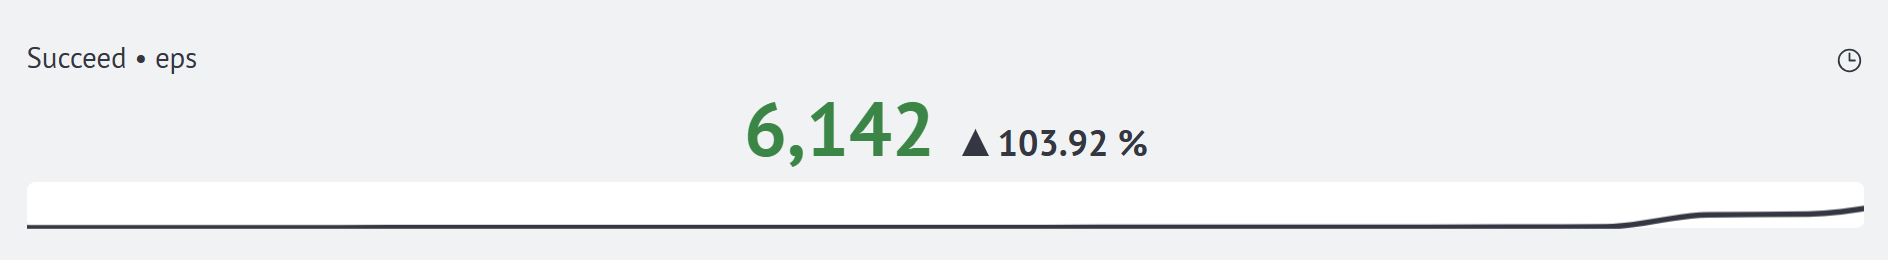
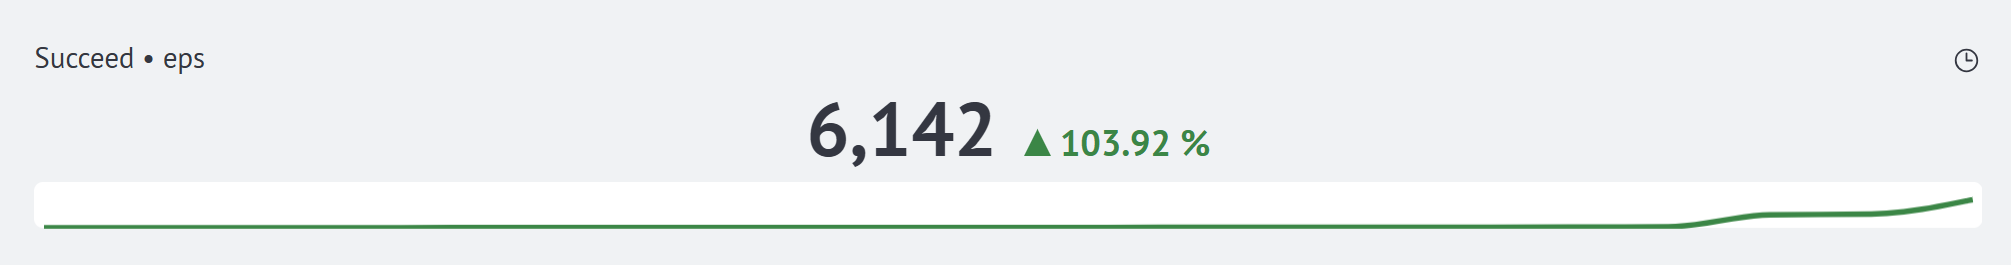
Display in Trend Mode (default and reversed palette)
Drilldown
The Single Value has the following set of parameters in the Drilldown tab:
| Parameter | Description | JSON Field |
|---|---|---|
| Drilldown Type | Allows selecting the type from the list: Search, Custom URL и Token Control. Defines the visualization's behavior on click. The following options are available: Search — if a search query is specified on the visualization card, a link icon is displayed in the top right corner. Clicking anywhere on the card navigates to the search page, with the search bar automatically populated with the specified query. Custom URL — when a custom URL is provided, a link icon is displayed. Clicking navigates to the specified address. Token Control — clicking changes the values of dashboard tokens. | drilldown.drilldownType |
| Search | Field for specifying the search query. Works only in Search mode. | drilldown.drilldownQuery |
| Time Filter | Allows selecting and configuring a filter by time interval. Works only in Search mode. | drilldown.drilldownSelectTimeToken |
| Custom URL | Field for setting a custom link. Works only in Custom Link mode | drilldown.drilldownText |
| Add Token | Allows specifying a list of dashboard tokens and their values. Each token is specified as a name-value pair. Works only in Dashboard Token Change mode | drilldown.drilldownTokens |
These parameters are applied to the visualization as follows:
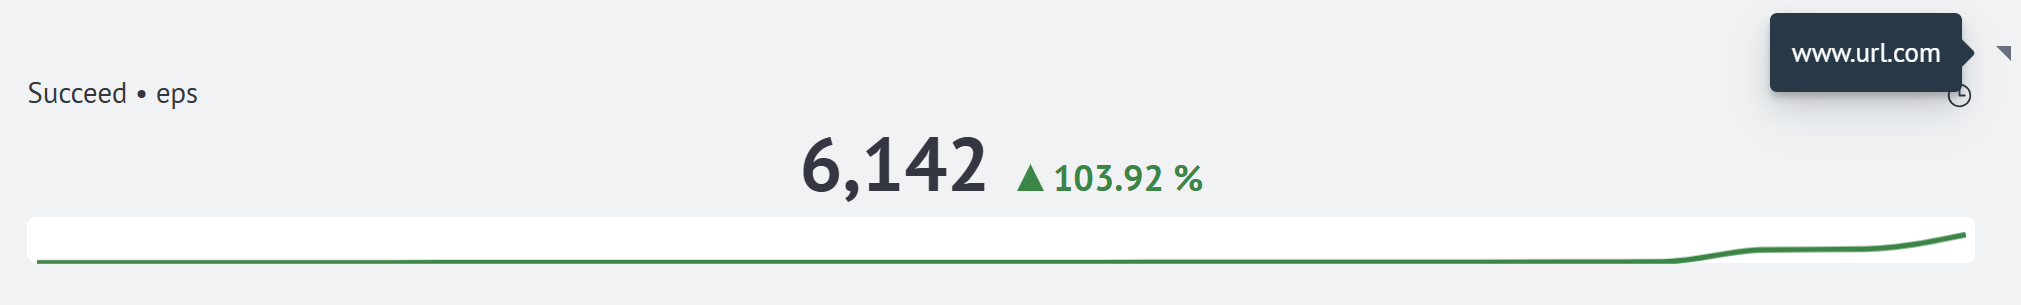
Hovering over the link icon displays a tooltip containing the full text of the link or search query.
Single Value creation
To create this type of visualization, it is worth using a query that returns an aggregation. It can be the number of some values, sum, number of unique values, and so on. SAF provides several aggregation commands. For the Single Value type, stats, timechart, aggs, timeaggs is considered.
The following is an example of a query with this command:
source windows_events
| aggs count(event.action)
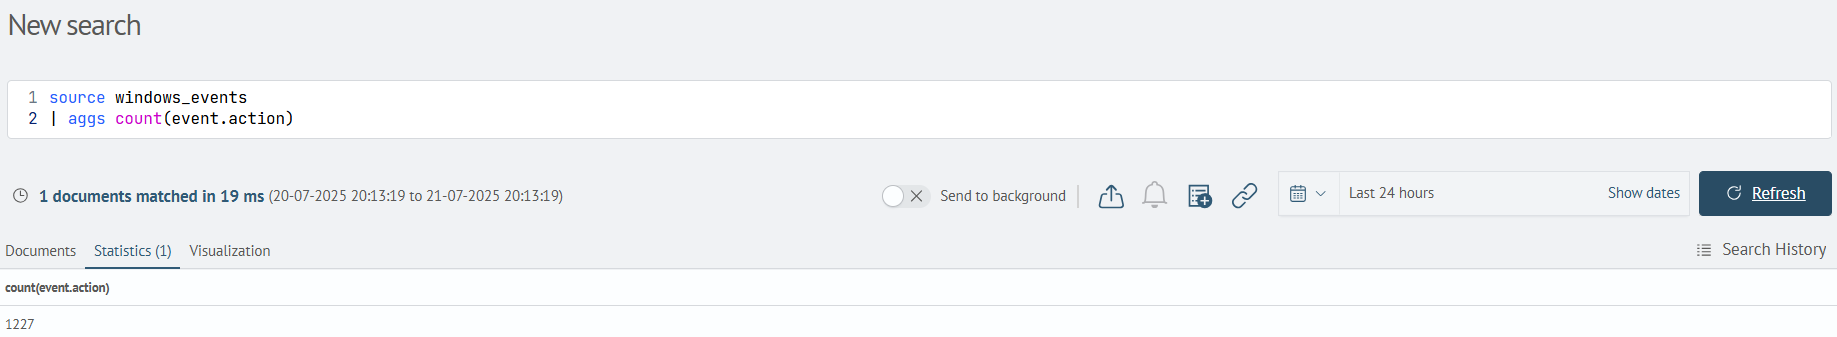
If you go to the Visualization tab. By default (if the query does not use timeaggs and timechart) you will see the Tabular view of the visualization:
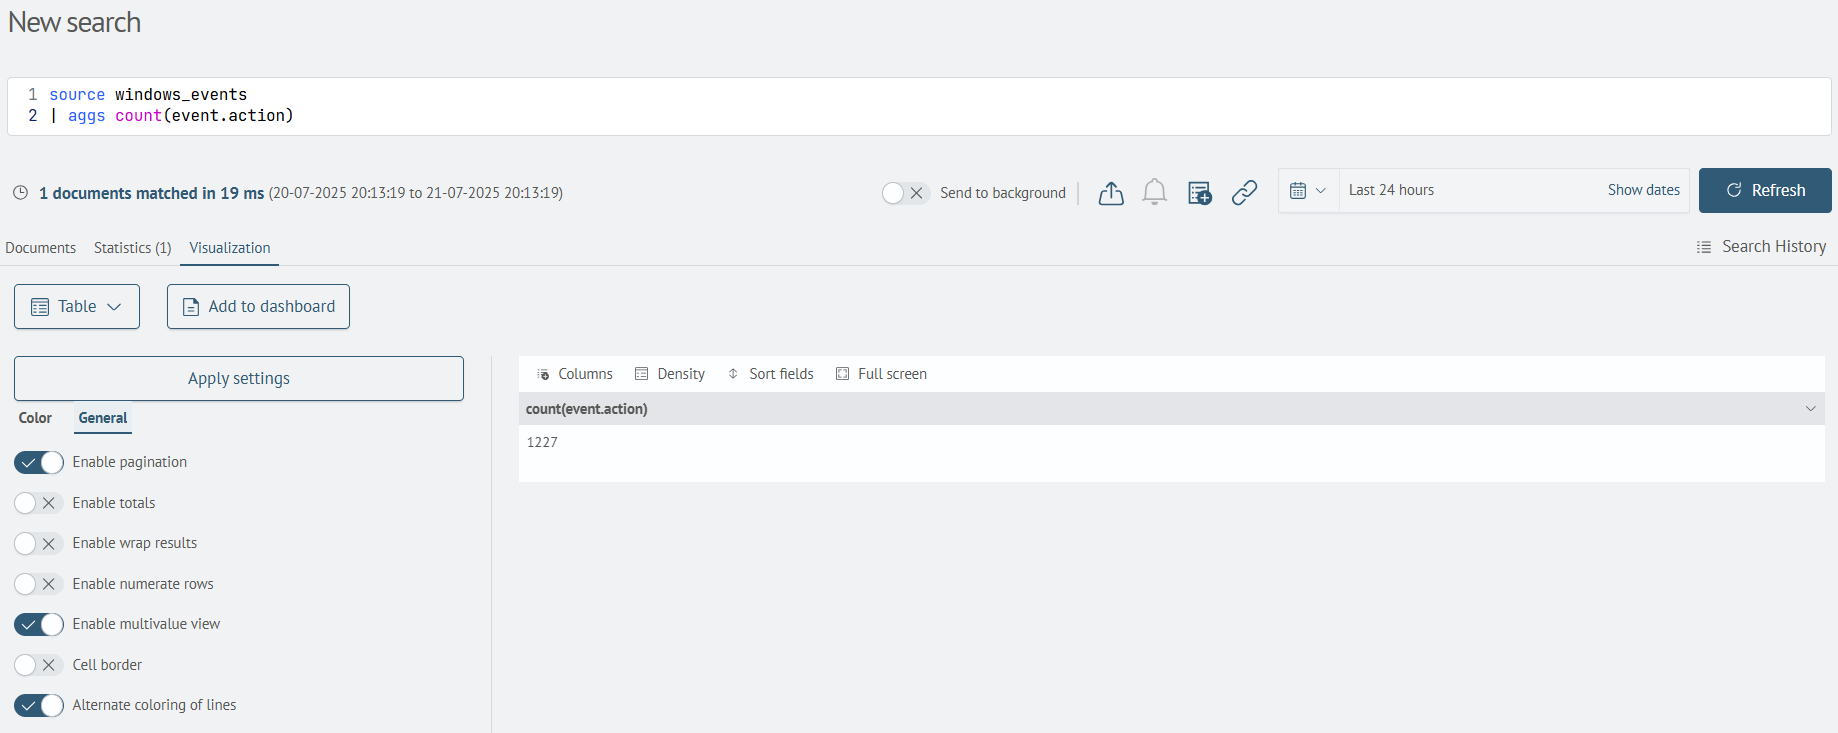
In the first dropdown list, you must select Single Value. After changing the parameter, an empty rectangle will be displayed, because no parameters are set. Below you need to specify the mandatory parameter Field for value, from the dropdown list you select the field, for example: count(event.action). The result will be as follows:
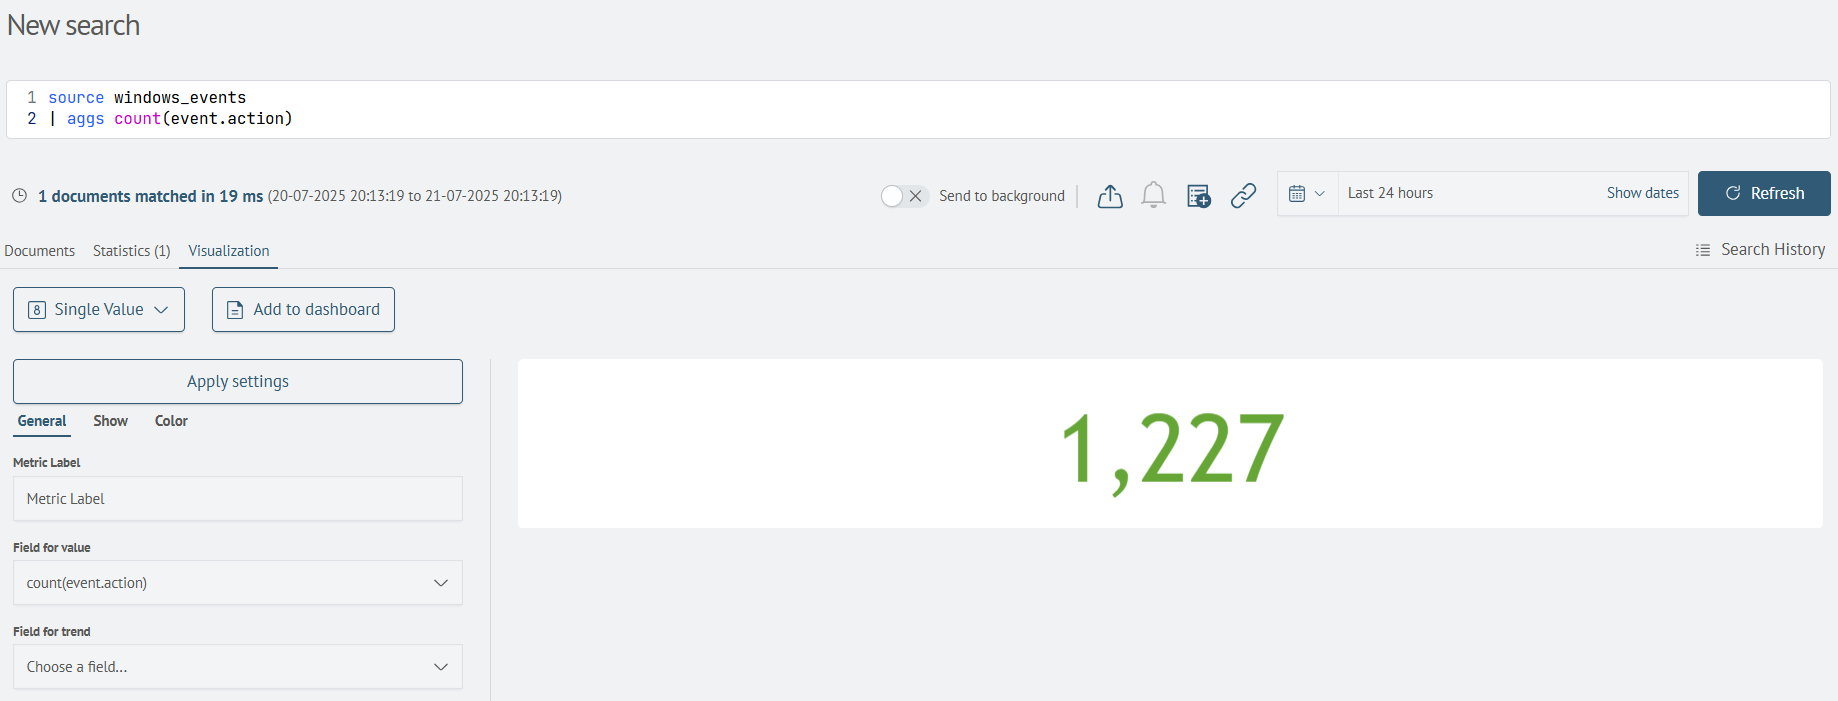
Now you can add this visualization to a dashboard by creating it or selecting an existing one. To do this, click the Add to dashboard button.
After that, you need to click the Save button. The visualization has been created and added.