Edit Panel
Overview
Editing visualizations involves changing search query parameters, selecting the type of visualization, customizing the appearance, and defining how items behave in a graph or other type of data representation.
This process involves:
- analyzing and adjusting queries to display the right information
- selecting the most appropriate type of visualization (e.g., graphs, charts, metrics, etc.)
- adjusting appearance parameters (such as colors, scaling, etc.)
- managing user interaction with the visualization (e.g. the ability to zoom, selecting parameters for display, etc.)
All these steps are aimed at creating an informative, clear and easy-to-use data visualization.
Visualization panel editing tools
Visualizations can be edited in the editor of the monitoring panel or on the Search page. The following visualization components can be configured anywhere:
| Icon | Component | Description |
|---|---|---|
 | Search query | The search query editor is needed to modify the query, the result of which will be displayed on the visualization |
 | Visualization type | The visualization type selection tool allows you to select the desired visualization type |
 | Visualization settings | The appearance and behavior editor allows you to control the visualization, the way it looks and the way it reacts to user actions |
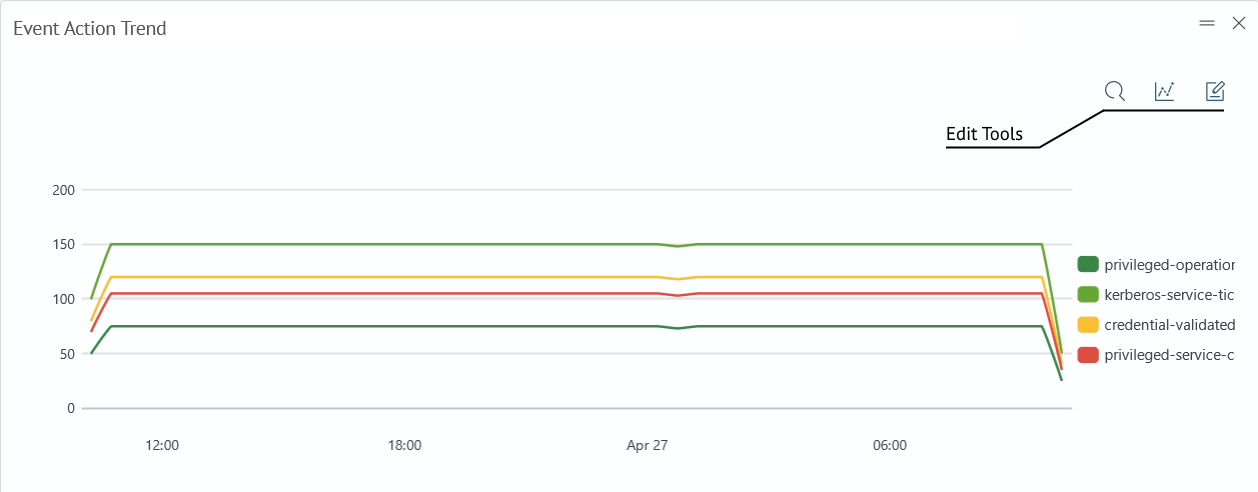
These components can be found in the dashboard editor in the upper right corner of each panel, or on the Search page if the visualization is built from it.
Visualization editing workflow
Editing visualization in Search Anywhere Framework is possible on the dashboard page or on the Search page.
Edit visualization on the Dashboard page
To edit a visualization on a dashboard page:
-
Go to the dashboard page and click
Editto go to the dashboard editor -
In the upper right corner of the dashboard for which you want to make changes, select the desired editing component
Component Interface Search query 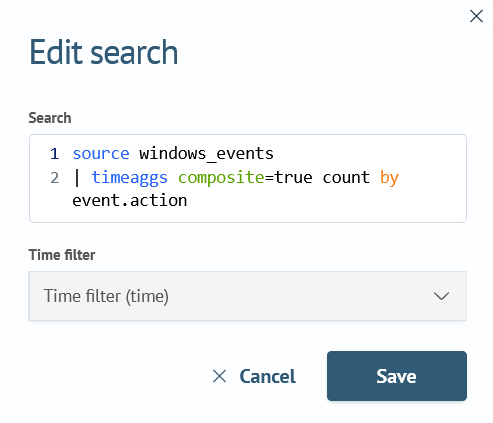
Visualization type 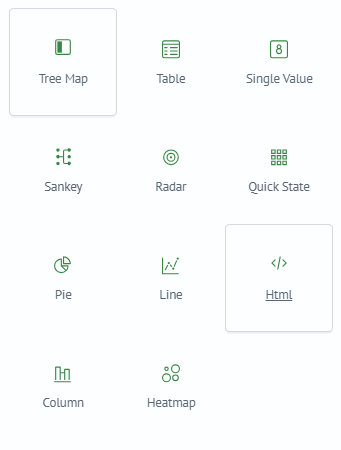
Visualization settings 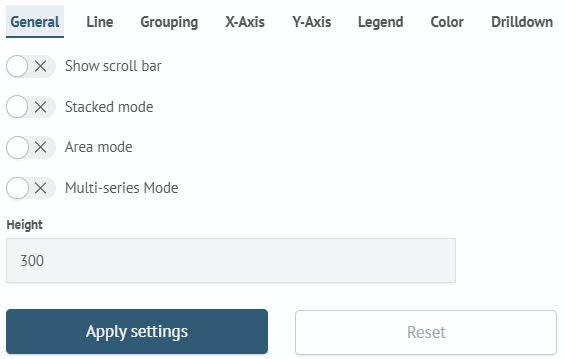
-
Make the required changes
-
Press
Saveto save the changes made orCancelto cancel
Edit visualization on the Search page
To edit the visualization on the Search page:
- Go to the
Searchpage by the pathMain Menu-Core-Search - Enter the query that will return the visualization or statistics
As an example, we will use a query with the command timeaggs.
source windows_events
| timeaggs count by event.code
returning the result in the Visualization tab.
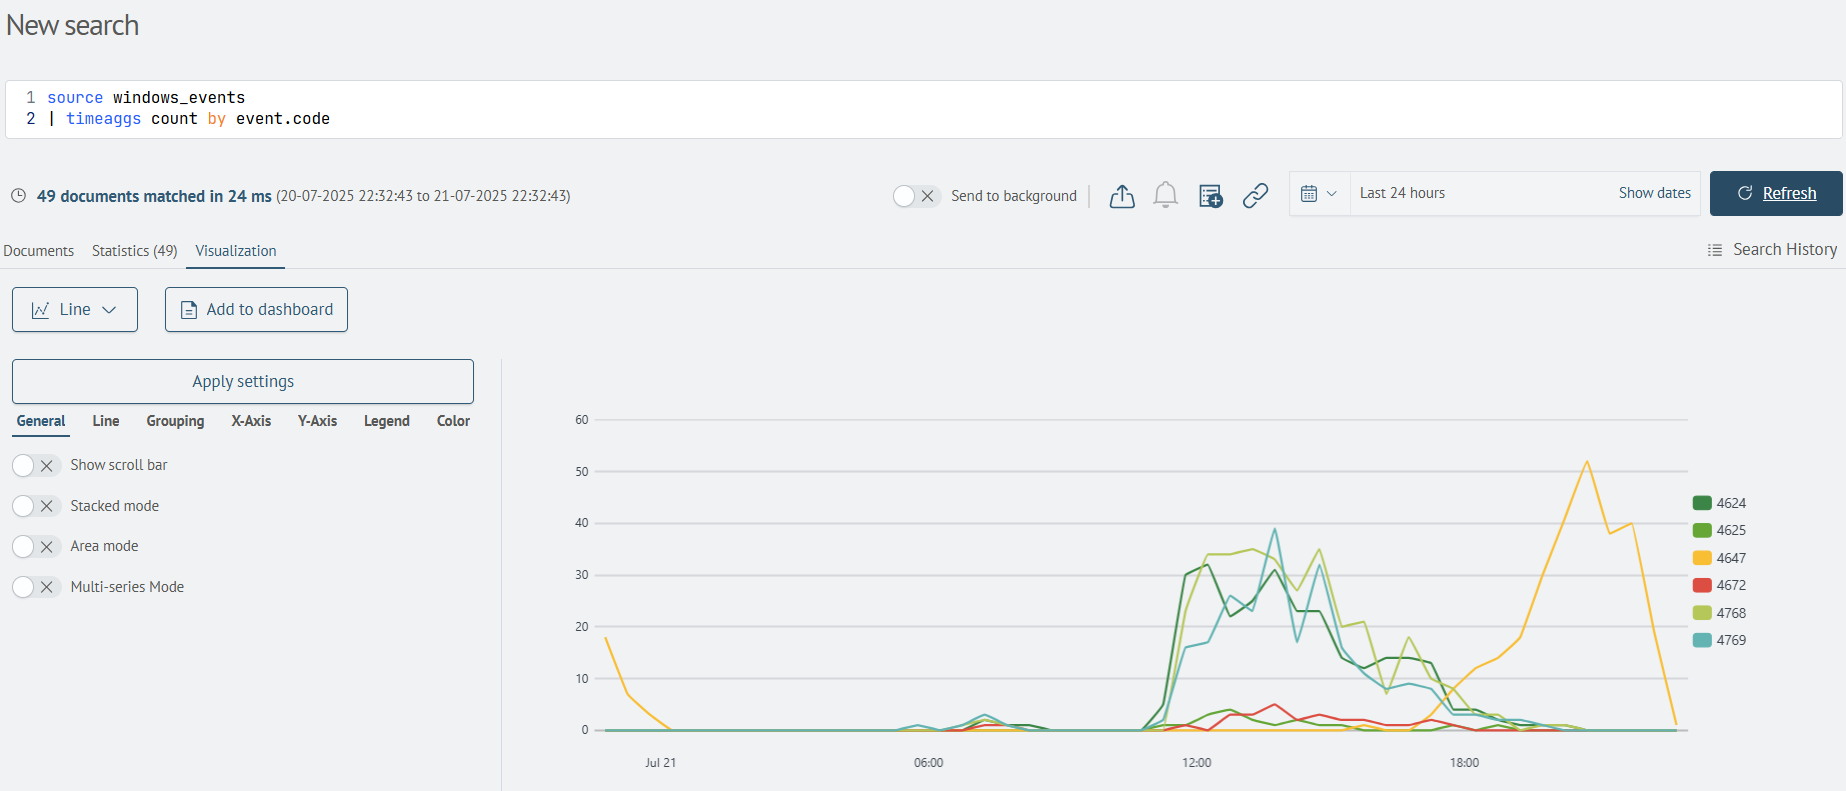
The arrangement of components here is different from the dashboard editor. The query in the Search line is a search query for visualization. And the editing tools of the visualization panel are located on the left side of the interface.
| Component | Interface |
|---|---|
| Search query | 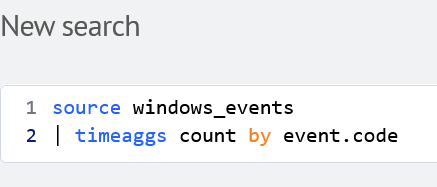 |
| Visualization type | 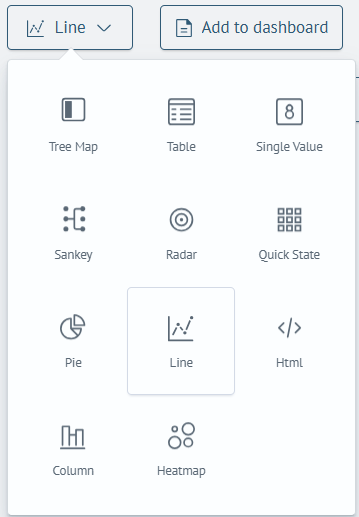 |
| Visualization settings | 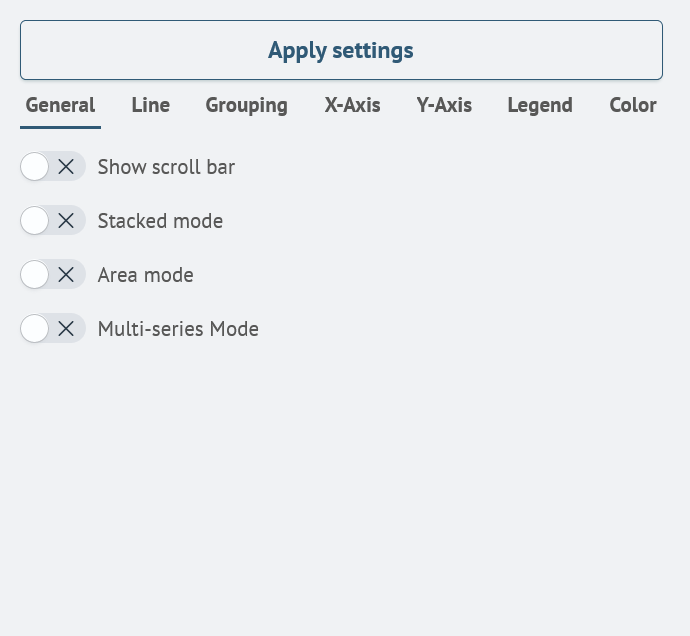 |
- Make the required changes
- (Optional) Click the
Add to Dashboardbutton to save the visualization
Additional information
Instant Update Mode
Dashboards feature an instant update setting that significantly simplifies and accelerates the visualization configuration process. When this setting is enabled, all changes made to visualization parameters in edit mode are applied and displayed immediately, without the need to press the Apply Settings button.
How to Enable
The dynamic update mode is controlled by a configuration flag set at the system level in the opensearch_dashboards.yml file.
To enable it, add or set the following parameter:
smart_monitor.dashboards.isReactiveVisualizationSave: true
After setting this flag, all dashboards will operate in reactive mode.
Changing the configuration requires a restart of OpenSearch Dashboards for the settings to take effect.
This setting is applied globally and affects the behavior of all dashboards in the system.