Search
Search Anywhere Concept
The concept of Search Anywhere in the Search Anywhere Framework represents an innovative approach to information retrieval, allowing users to search across various data sources by combining them within a single query. This unique functionality enables users to find the necessary information in different data repositories such as databases, event logs, text documents, and many others, without the need to switch between different interfaces or tools. Users can focus on formulating precise queries and obtaining comprehensive results, significantly simplifying the process of data search and analysis.
In the Search Anywhere Framework, you can search for any fragment of data, even if you are not sure exactly where to look. This is achieved through powerful search and analysis capabilities that allow searching across all data fields or setting broad search parameters covering all information.
Working with Data Stores. Types of Data Stores
The Search Anywhere Framework platform provides the ability to work with various types of data stores, including OpenSearch, ClickHouse, and Hadoop. This wide range of supported data stores ensures flexibility and scalability in data processing and analysis. OpenSearch provides fast and flexible data search and analytics, ClickHouse offers high performance for analytical queries, and Hadoop enables distributed storage and processing of large volumes of data. With these capabilities, users can choose the most suitable data store depending on their project requirements and process data efficiently and reliably.

Indexes and Index Templates
In addition to the aforementioned capabilities, working with search queries in the Search Anywhere Framework also includes the use of indexes and index templates. Indexes allow for efficient organization and structuring of data for quick access and processing. Creating indexes optimizes the information retrieval process, speeding it up and enhancing performance.
Index templates, in turn, are configuration models that define the structure and parameters of indexes. Creating and managing index templates standardizes the process of creating indexes, ensuring consistency and uniformity in data structure. This simplifies administration and provides ease of scalability for the system.
Description of the "Search" Component
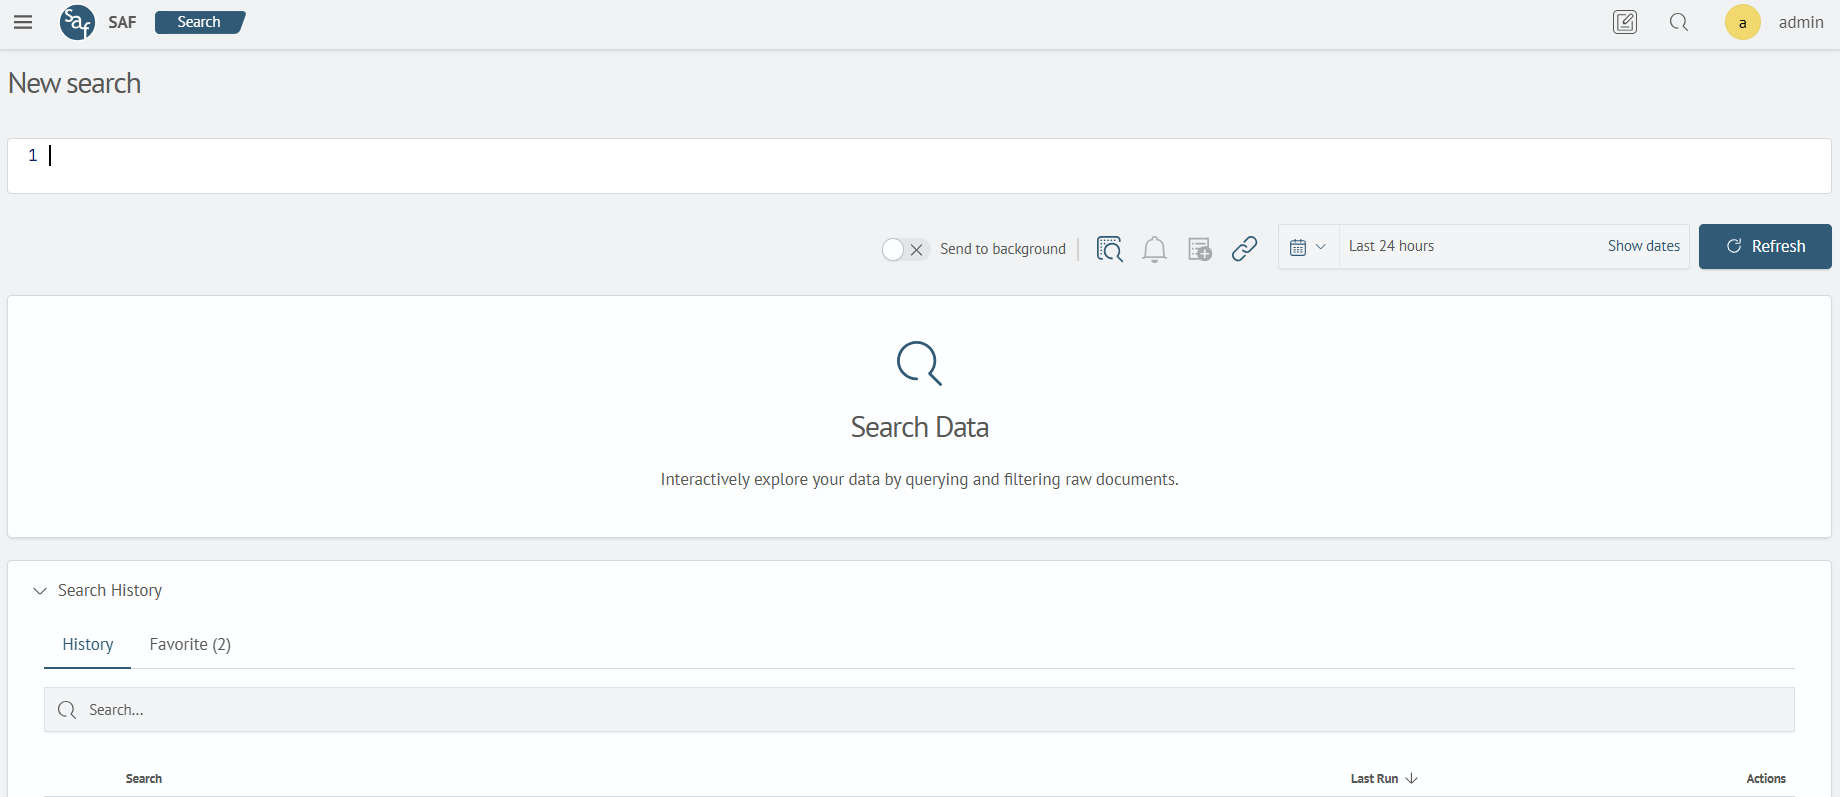
The Search component of the Core module is designed for writing search queries using the Search Anywhere Framework Language (hereinafter referred to as SAFL).
The page features a field for entering search queries, a field for displaying search results, as well as a query history.
In addition to the search in Search Anywhere Framework, there is a time filter designed to select a time interval for which information will be displayed on the dashboard.
The convenience of working with search queries in the Search Anywhere Framework lies not only in the ability to retrieve query results from various data stores. This tool provides functionality that optimizes the entire process of working with queries and their results, increasing efficiency and improving analytical capabilities.
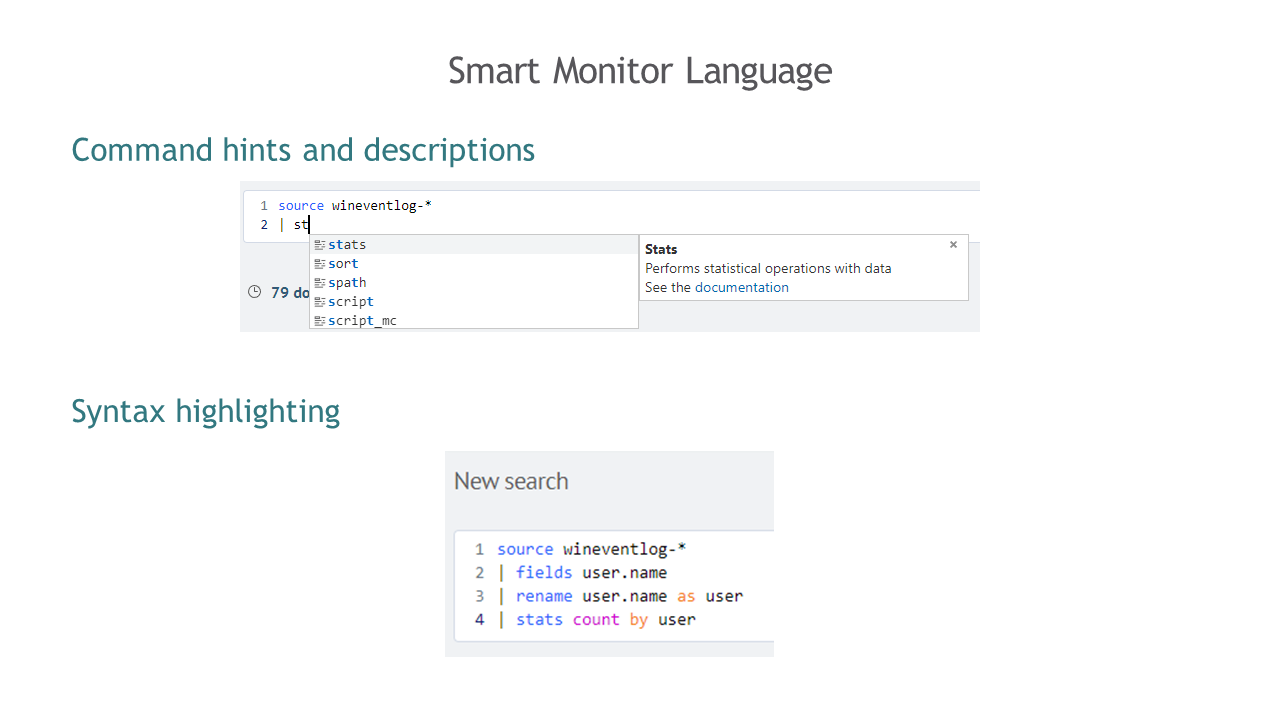
Thanks to autocomplete and suggestion mechanisms, users are provided with an intuitive and convenient interface for formulating queries. This helps reduce the time spent on creating queries and reduces the likelihood of errors.
Additionally, the platform offers features for saving and reusing queries. This allows users to save time on recreating similar queries and ensures consistency and accuracy of analytical data.
Moreover, Search Anywhere Framework provides functions for analyzing query results, including the ability to filter, sort, and visualize data. This enables users to quickly and efficiently find the necessary information, draw conclusions, and make informed decisions based on analytics.
In conclusion, working with search queries in the Search Anywhere Framework becomes not only efficient but also convenient and intuitive, allowing users to maximize the potential of analytical data to achieve their goals and objectives.
Convenience of Working with Search Queries
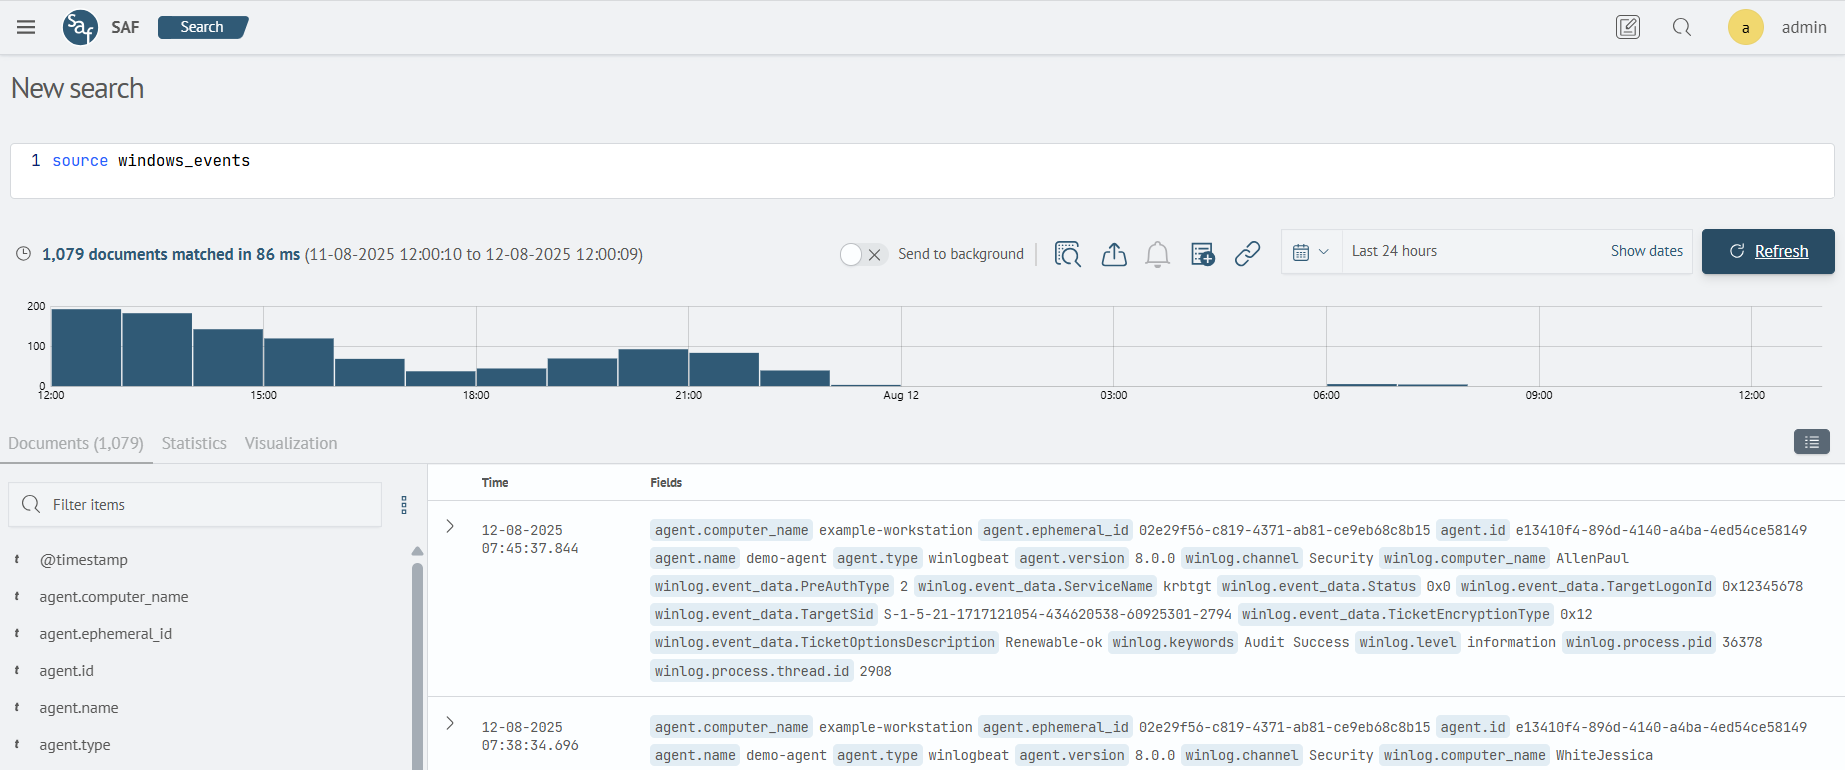
The search interface provides the ability to execute search queries and display results on the results panel. To write a query, enter text in the New Search field and click the Refresh button. If the query is correctly composed, the results will be displayed on the corresponding panel.
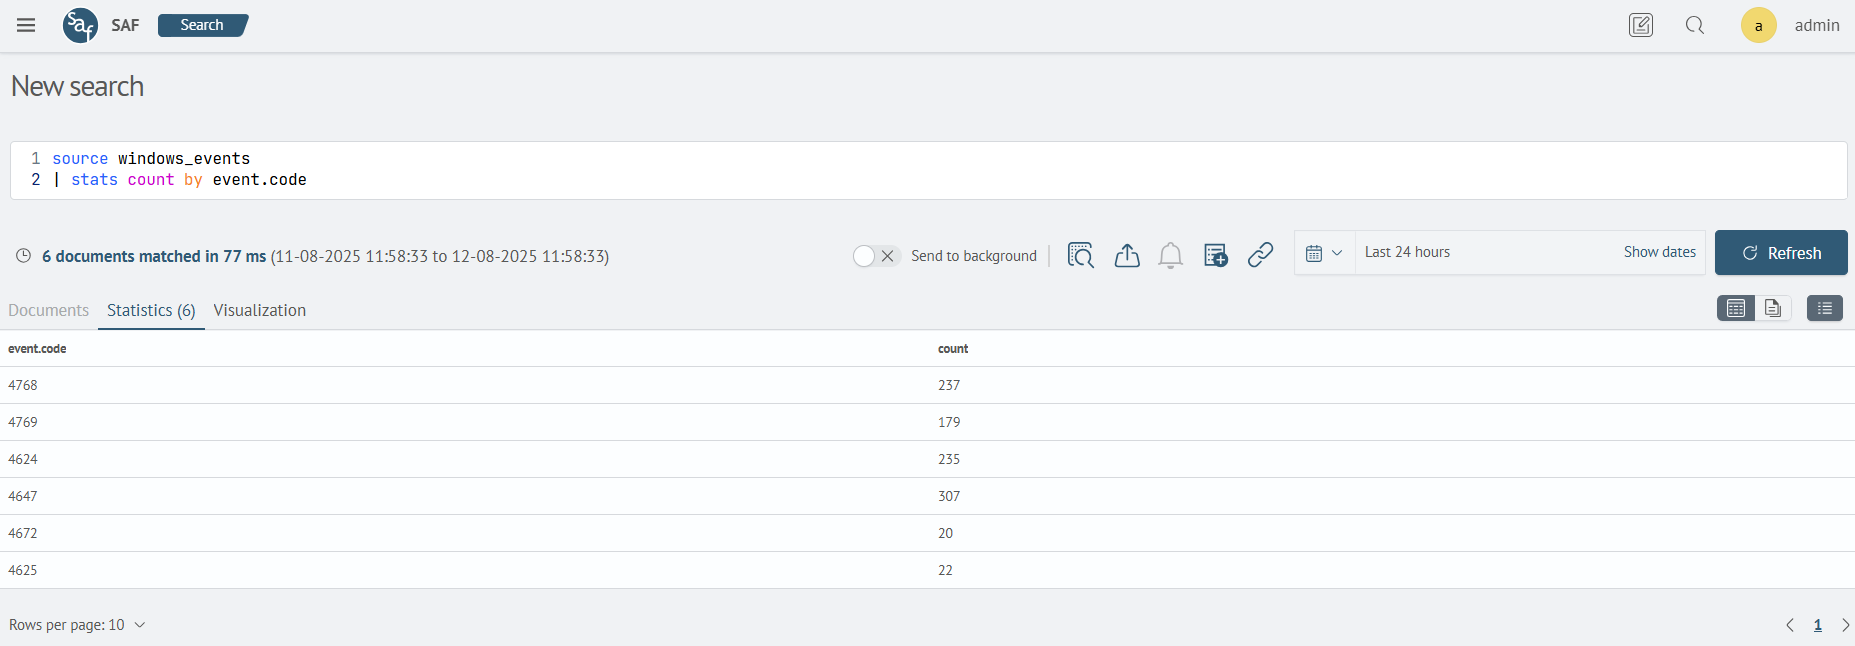
Above the results panel, a brief summary of the search query execution is displayed:
- The number of results obtained from executing the query
- Query execution time
- The time interval for which the query results are displayed
Above the results panel, a time filter is displayed, intended to specify the time period for which the query results will be displayed.
To stop executing a search query, click the stop execution button on the toolbar next to the time filter.
For more detailed information on how to use search, please refer to the Search Queries section.
Visualizations
In the Search Anywhere Framework, data visualization is an important aspect of working with information. Two key components in this area are the Timeline and Field bar.
Timeline
Timeline: This is a graphical representation of data that allows visualizing the distribution of search or analysis results over time. The timeline displays the number of results over time, helping to identify trends, activity peaks, or other interesting aspects of data dynamics. The Timeline is often used for event monitoring, analyzing time trends, and detecting anomalies.
Field Bar
Field bar: This visualization component allows representing the distribution of results by values of a specific field or data attribute. The field bar displays the number of results associated with each unique value of the field. This helps identify the most significant categories or indicators in the data and conduct a detailed analysis of their distribution.
Rarely Occurring Values
Fields whose values occur less frequently in the dataset than a specified threshold are not shown in the field bar. This threshold is configured in the cluster settings at _cluster/settings.
| Name | Description | Default Value |
|---|---|---|
sme.core.field_threshold_percent | The minimum percentage of documents in which a field must appear for it to be displayed in the field bar. | 0.1 |
Visualization of Search Results
To visually represent the results of a query, you can use the Visualization tab on the results panel.
The type of visualization is displayed on the left side of the visualization settings panel. In the image below, the default type Table is selected - the query results are displayed in a table format.
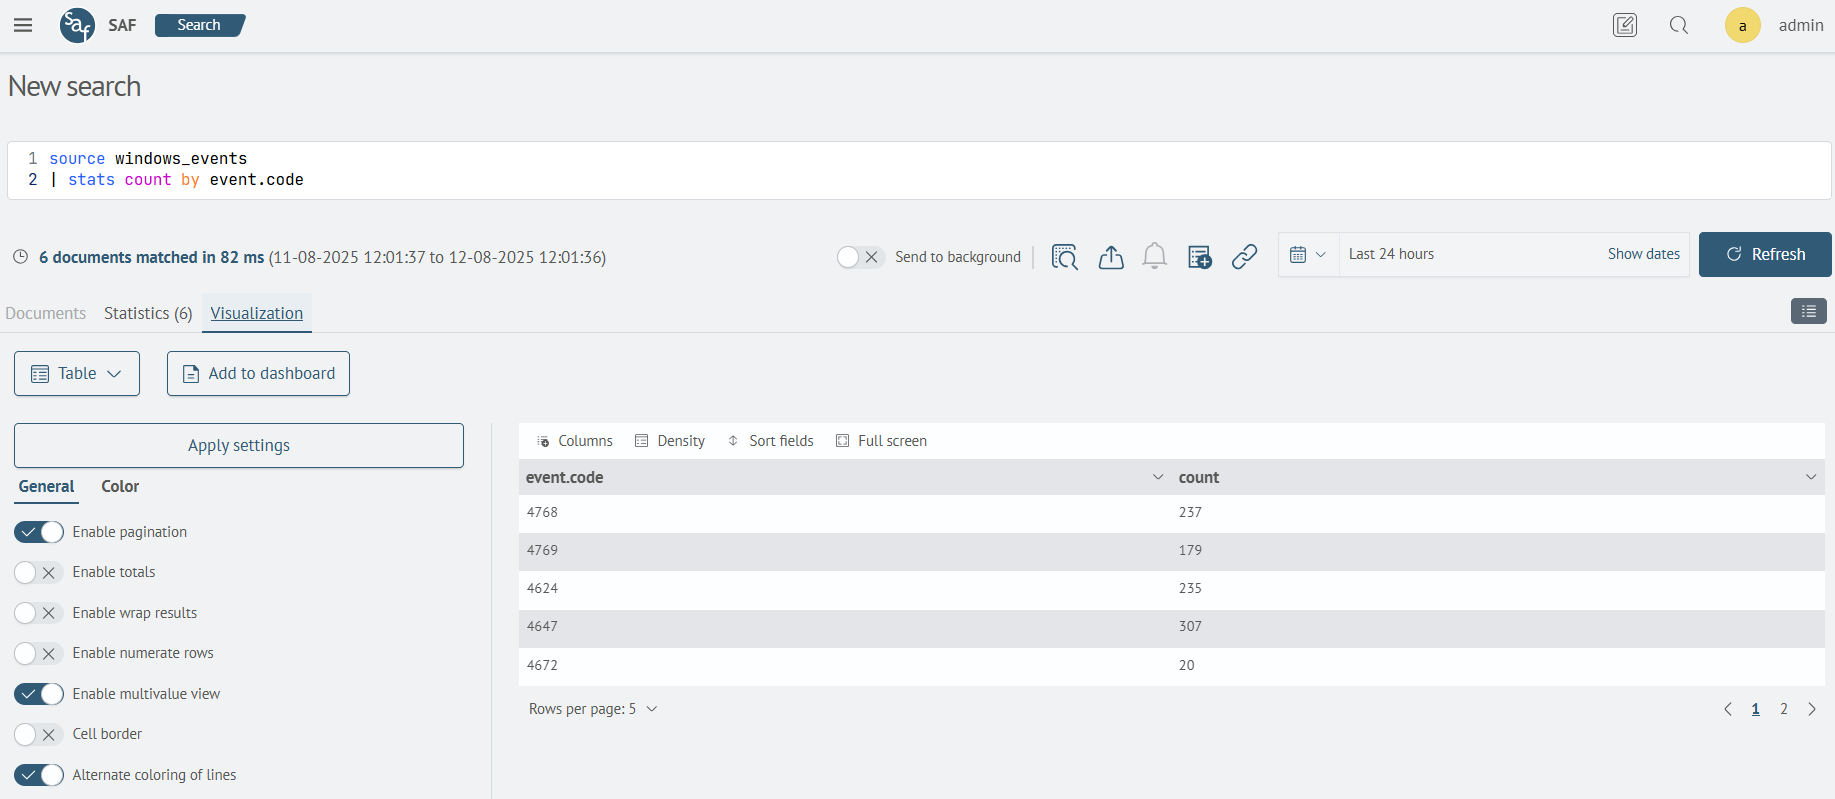
To select a visualization type, click on the visualization icon button displaying the current type of visualization, and choose the desired visualization type.
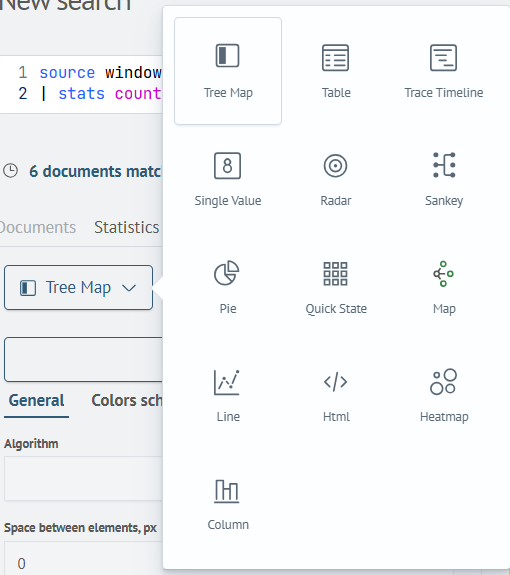
The following types of visualizations are available:
- Table
- Column Chart
- Line Chart
- Pie Chart
- Single Value Metric
- Heatmap
- Tree Map
- Quick State
- Map Visualization
- Trace Timeline
For more detailed information on how to use visualization features, please refer to the Visualizations section.