Graph
Description
Graph is a visual representation of monitoring components, consisting of nodes (services) and connections between them.
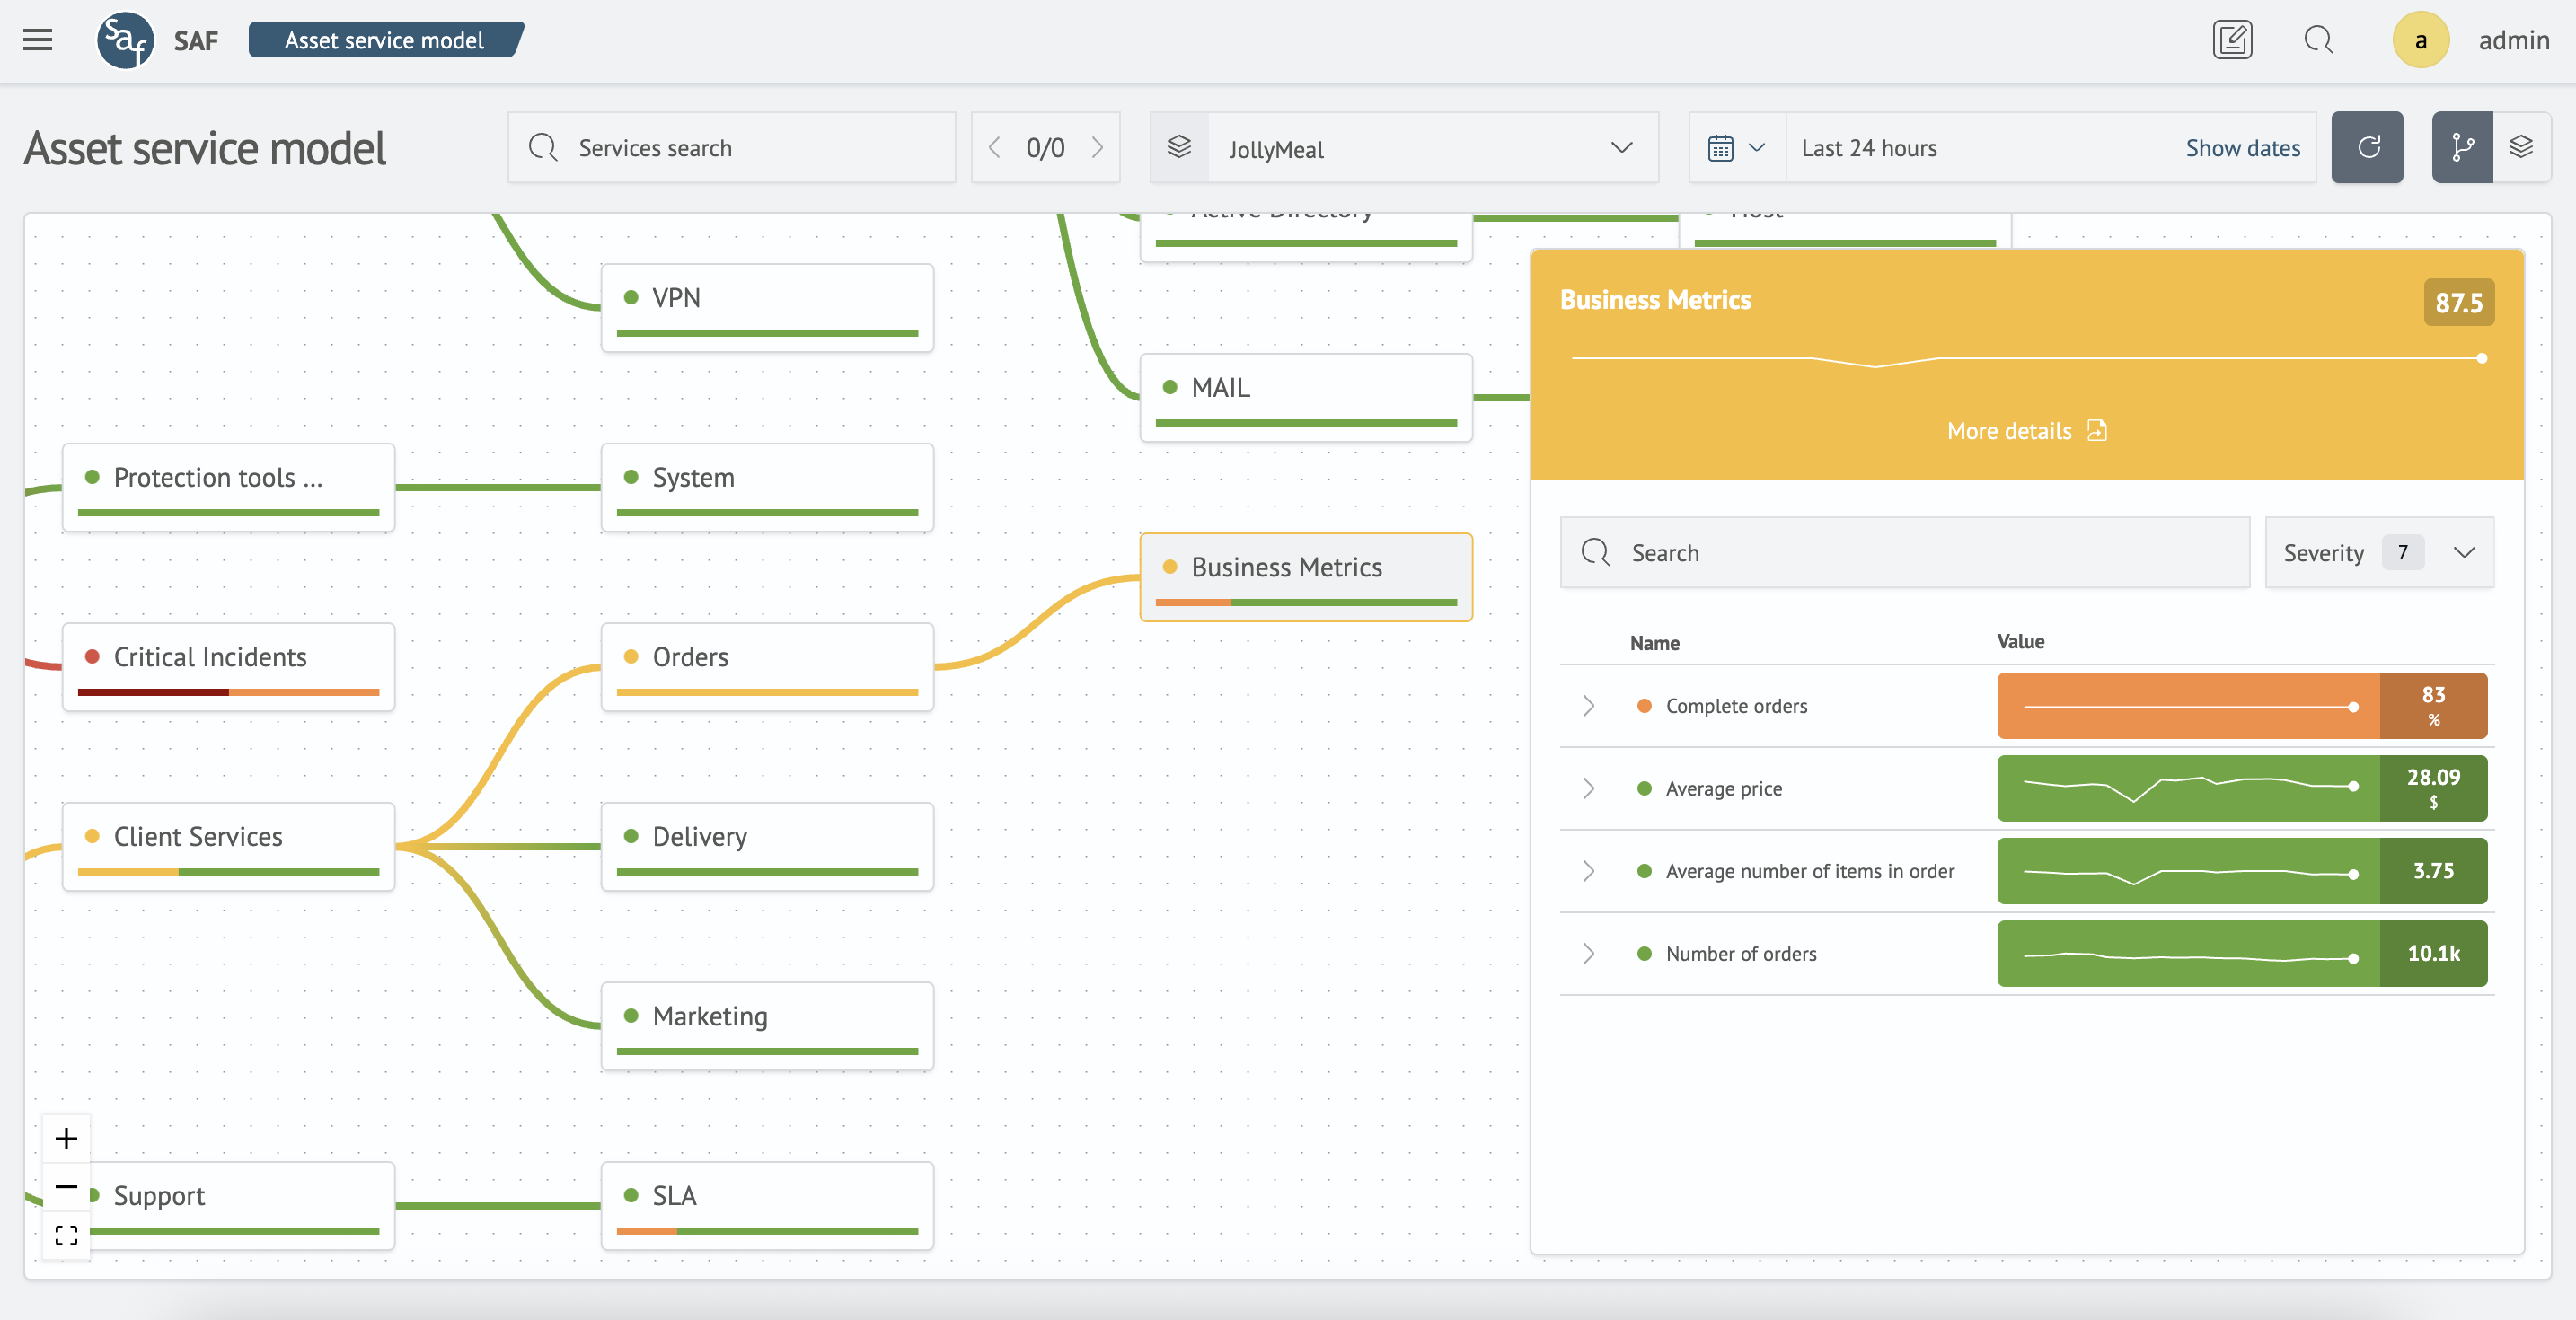
The page interface includes a control panel at the top and a main area (canvas) displaying the graph itself along with a metrics panel.
Example page:
Key Features
The graph enables you to:
- view current service statuses
- visualize relationships between services
- track metrics for each service
- quickly filter services to show only child dependencies
- search services by name
- view data for selected time ranges
- use auto-refresh for real-time monitoring
- navigate to detailed service information
Control Panel
This panel allows you to search for services on the graph, set time ranges, select layers, and quickly switch between different view modes.

Основные элементы панели:
- Service search field
- Search control buttons and statistics
- Layer selection dropdown
- Time range selector
- "Refresh data" button
- Graph and Layer toggle switch
Service Search
Allows you to find services on the graph and center the view on them. After entering a query, the first found service will be automatically centered.
Using the arrow buttons (item 2), you can navigate between found services. The numbers show the current item's position and the total number of matches (e.g., 1/5).
You can also use the Enter key to jump to the next search result and Escape to reset the search.
Layer Selection
This dropdown menu allows quick switching between layers. To create or edit layers, switch to the layer display mode..
Time Range Selection
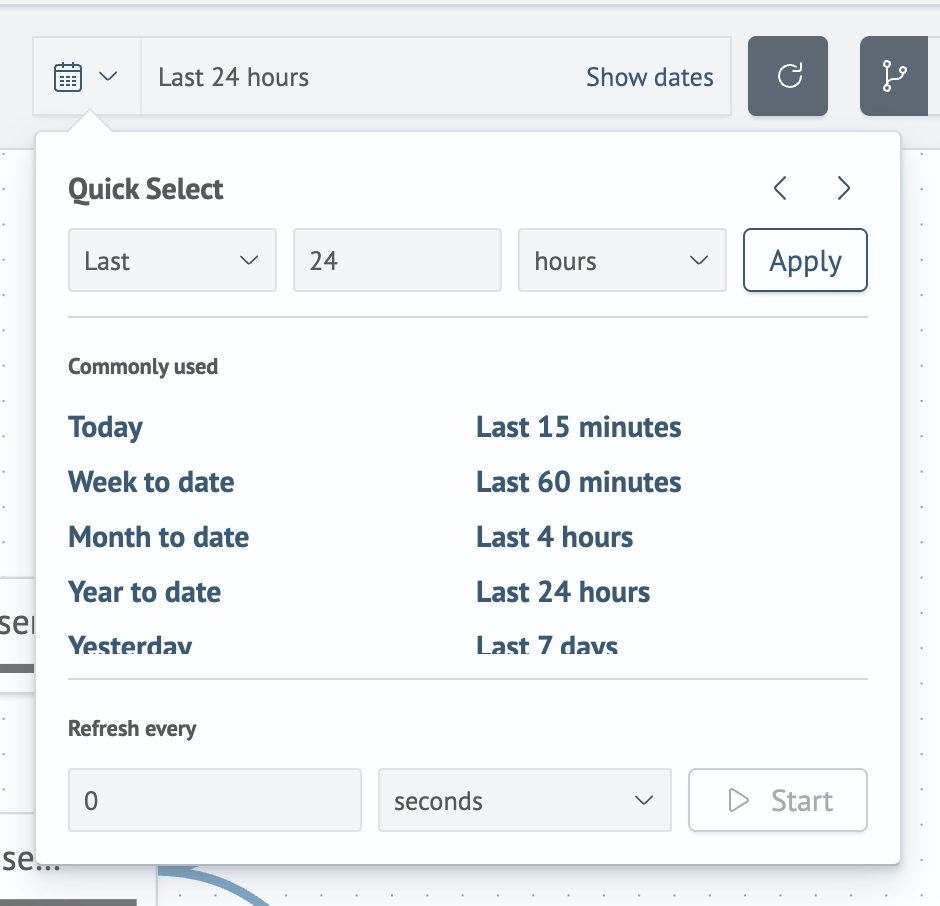
This control element enables flexible configuration of the time range for displayed data. The dropdown also includes settings for automatic refresh intervals. To activate it, select a period and click Start. To stop - click Stop.
For more details on working with the time filter, see the Working with Time Filters section.
Data Refresh
Clicking this button triggers a manual data refresh from the server.
The following elements are updated:
- the entire graph and its services
- metric indicators within services
- all data on the open Metrics Panel
Data also refreshes automatically with every time range change.
Quick View Switching
Enables instant toggling between graph and layer view modes.
Service (Node)
Each node on the graph represents an individual service.
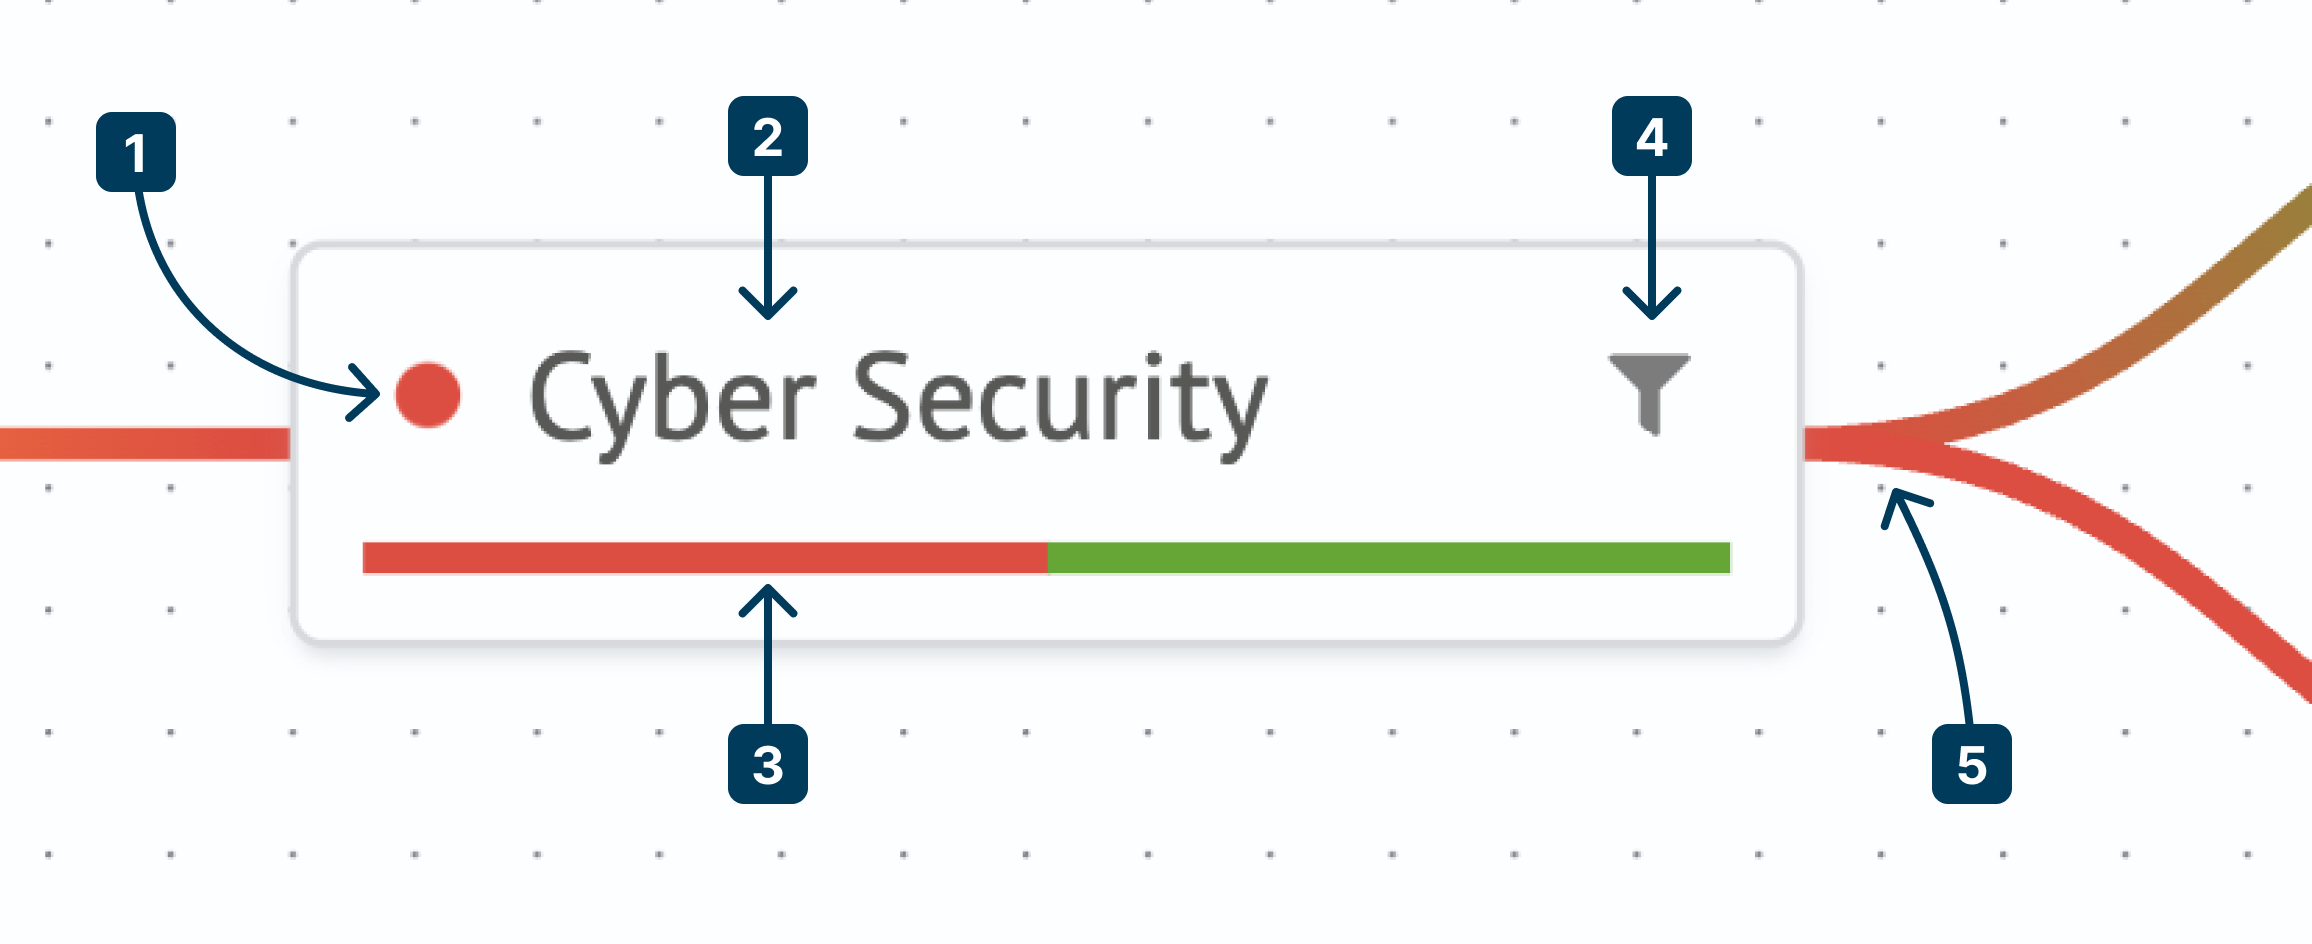
Key service elements:
- Service health indicator
- Service name
- Contained metric indicators
- Filter button (hides all parent nodes to focus on child dependencies)
- Connections to other nodes
A service may have one or multiple connections, or none at all. All graph connections are directed from left to right.
Metrics Panel
The metrics panel appears on the right side of the screen and displays detailed data for the selected service in chart format for the specified time range.
- to open the panel, click any service
- to close the panel, click any empty area on the graph canvas
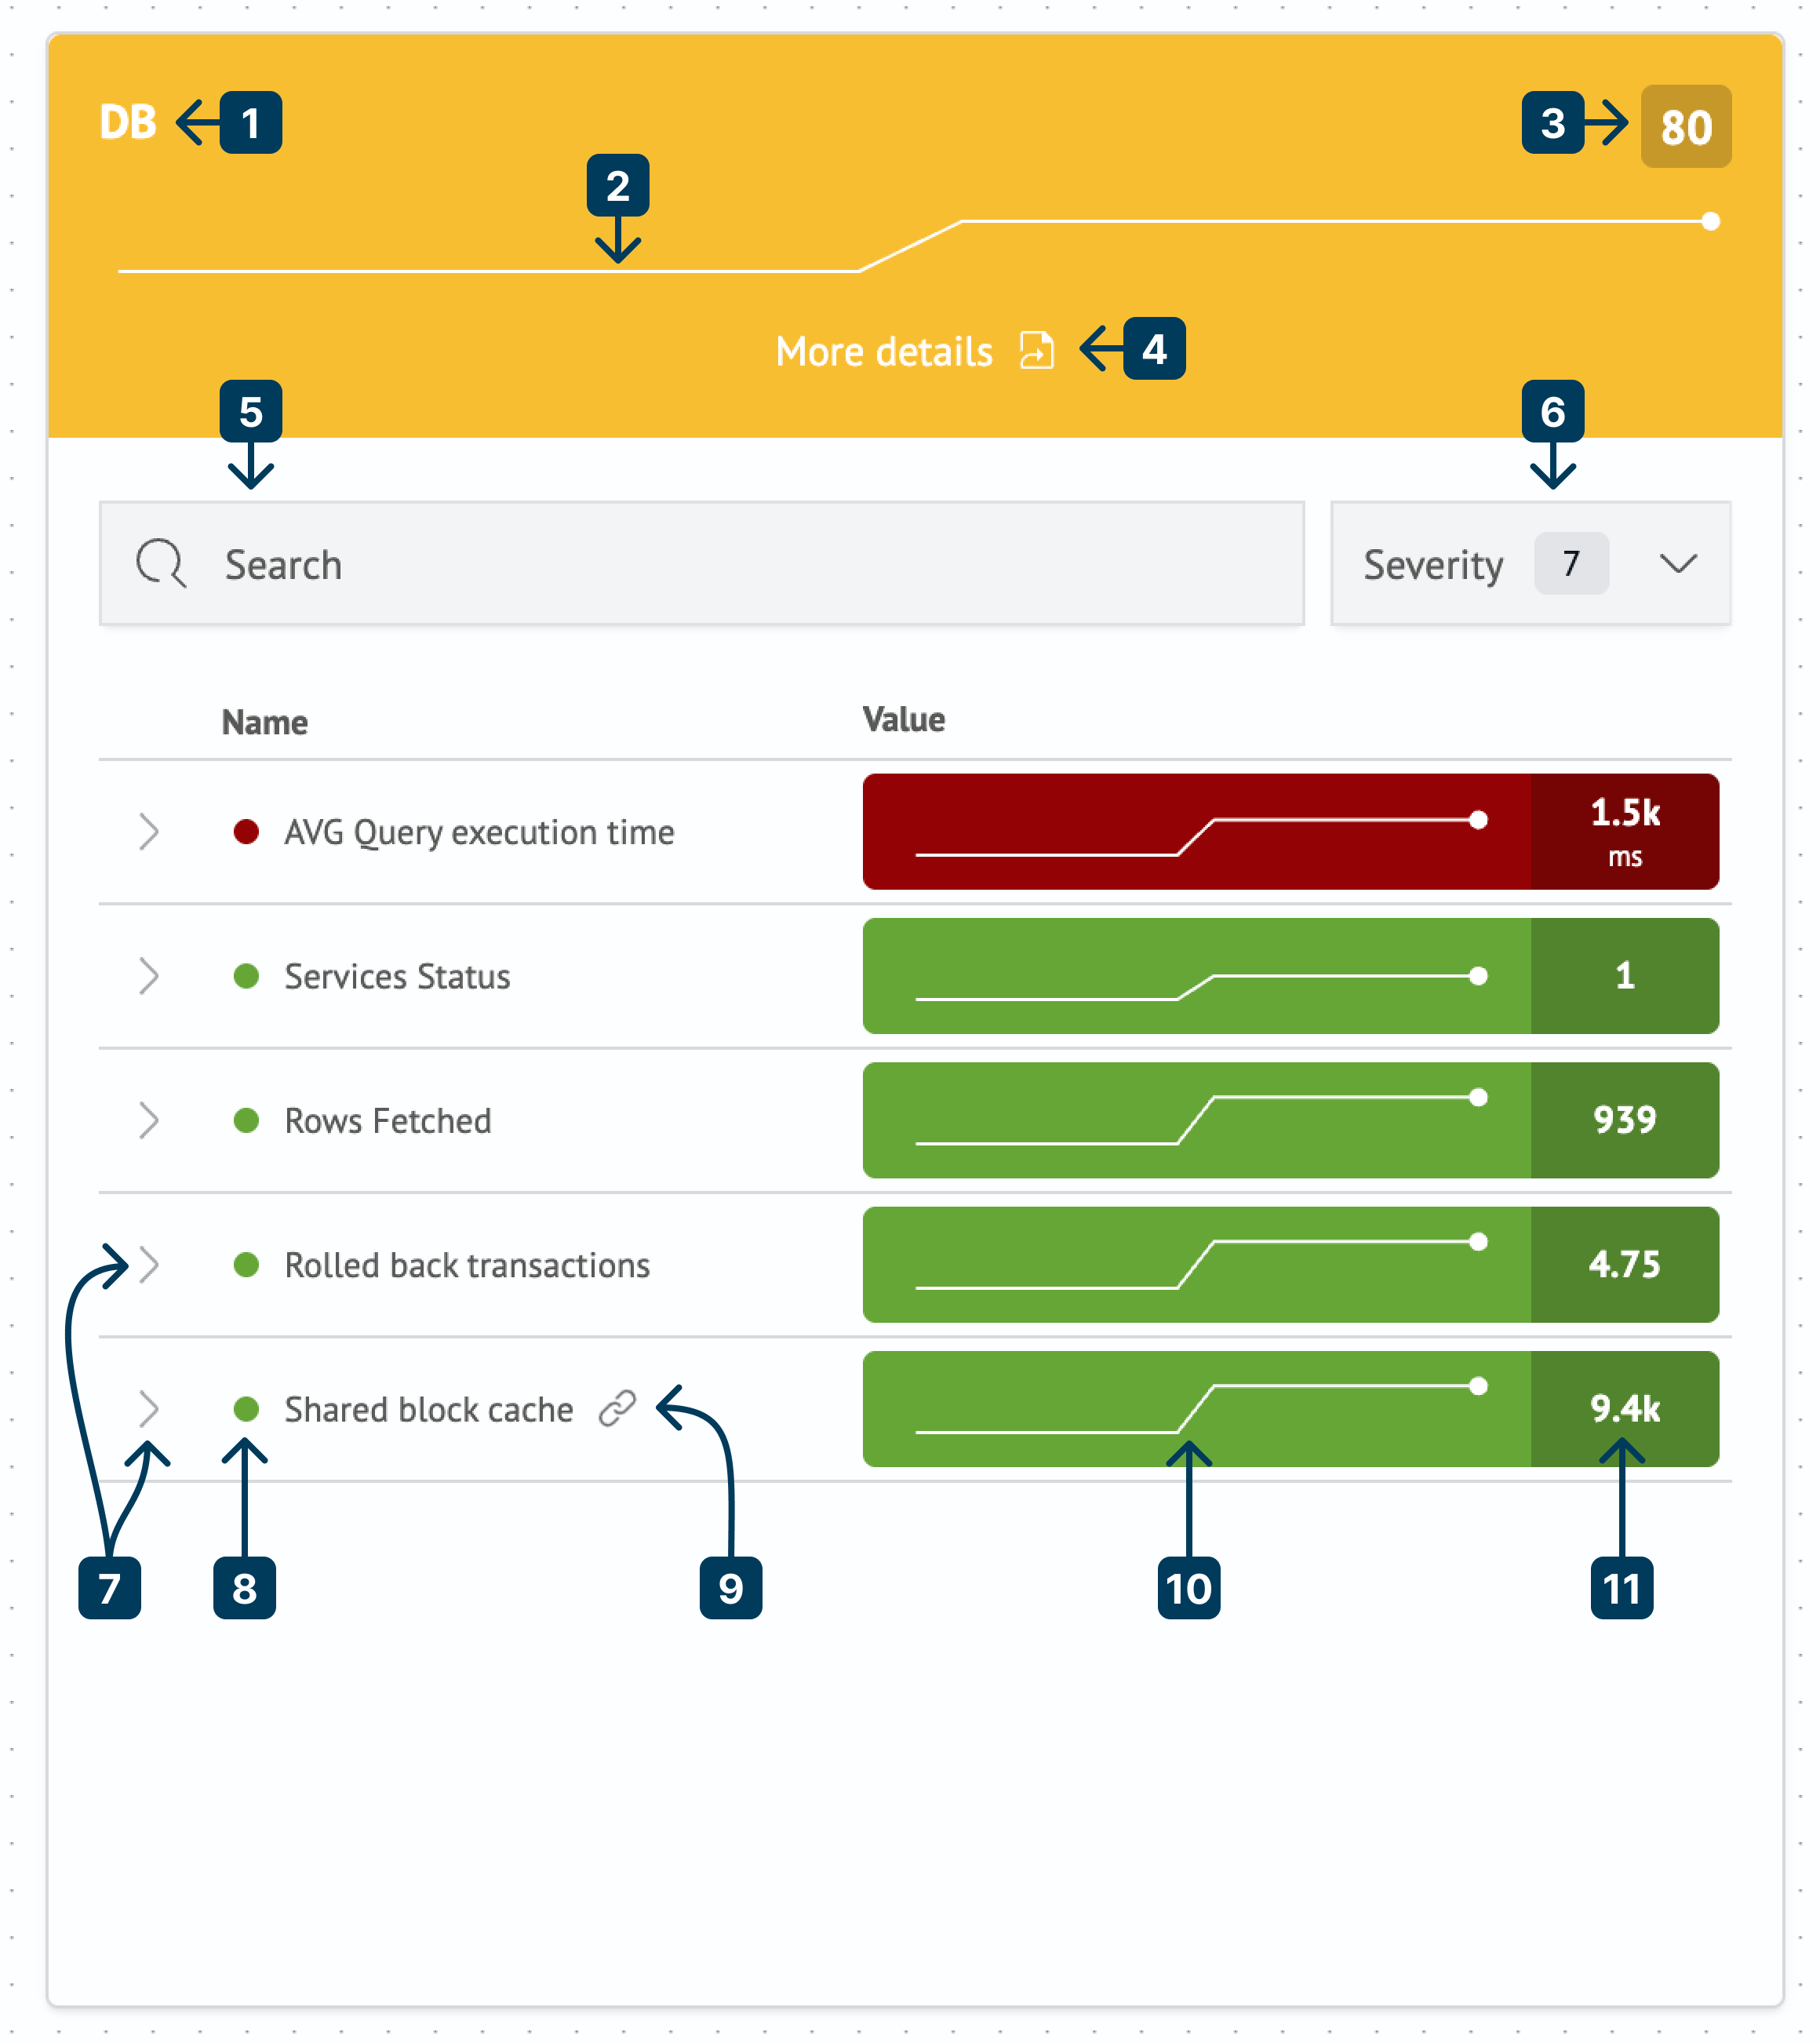
Main panel components:
- Service name
- Aggregated service graph for the selected time range
- Last received value for the service
- Link to service settings
- Metric name search
- Metric status filter
- Nested objects toggle button (icon disabled when no objects exist)
- Metric status indicator
- Related service icon (indicates metric belongs to another service)
- Metric data visualization
- Metric last value and unit of measurement
Service Data Visualization
The top section of the panel displays the aggregated service data graph. Hovering over the graph line shows a tooltip with exact date and value. The Details link navigates to this service's configuration page.
Search and Filtering
Use the search field to filter metrics by name. The adjacent status filter (e.g. critical, normal) can be combined with the name filter.
Metrics
Each row in the list represents one metric. If a metric's configuration contains an external link (in the Details section), its graph becomes clickable. Clicking it opens the specified URL in a new tab.
Metric Objects
Some metrics may be divided by objects.
Metric objects are homogeneous entities (e.g. servers, network nodes, application modules) for which the specified metric is calculated individually.