Triggers Dashboard
Overview
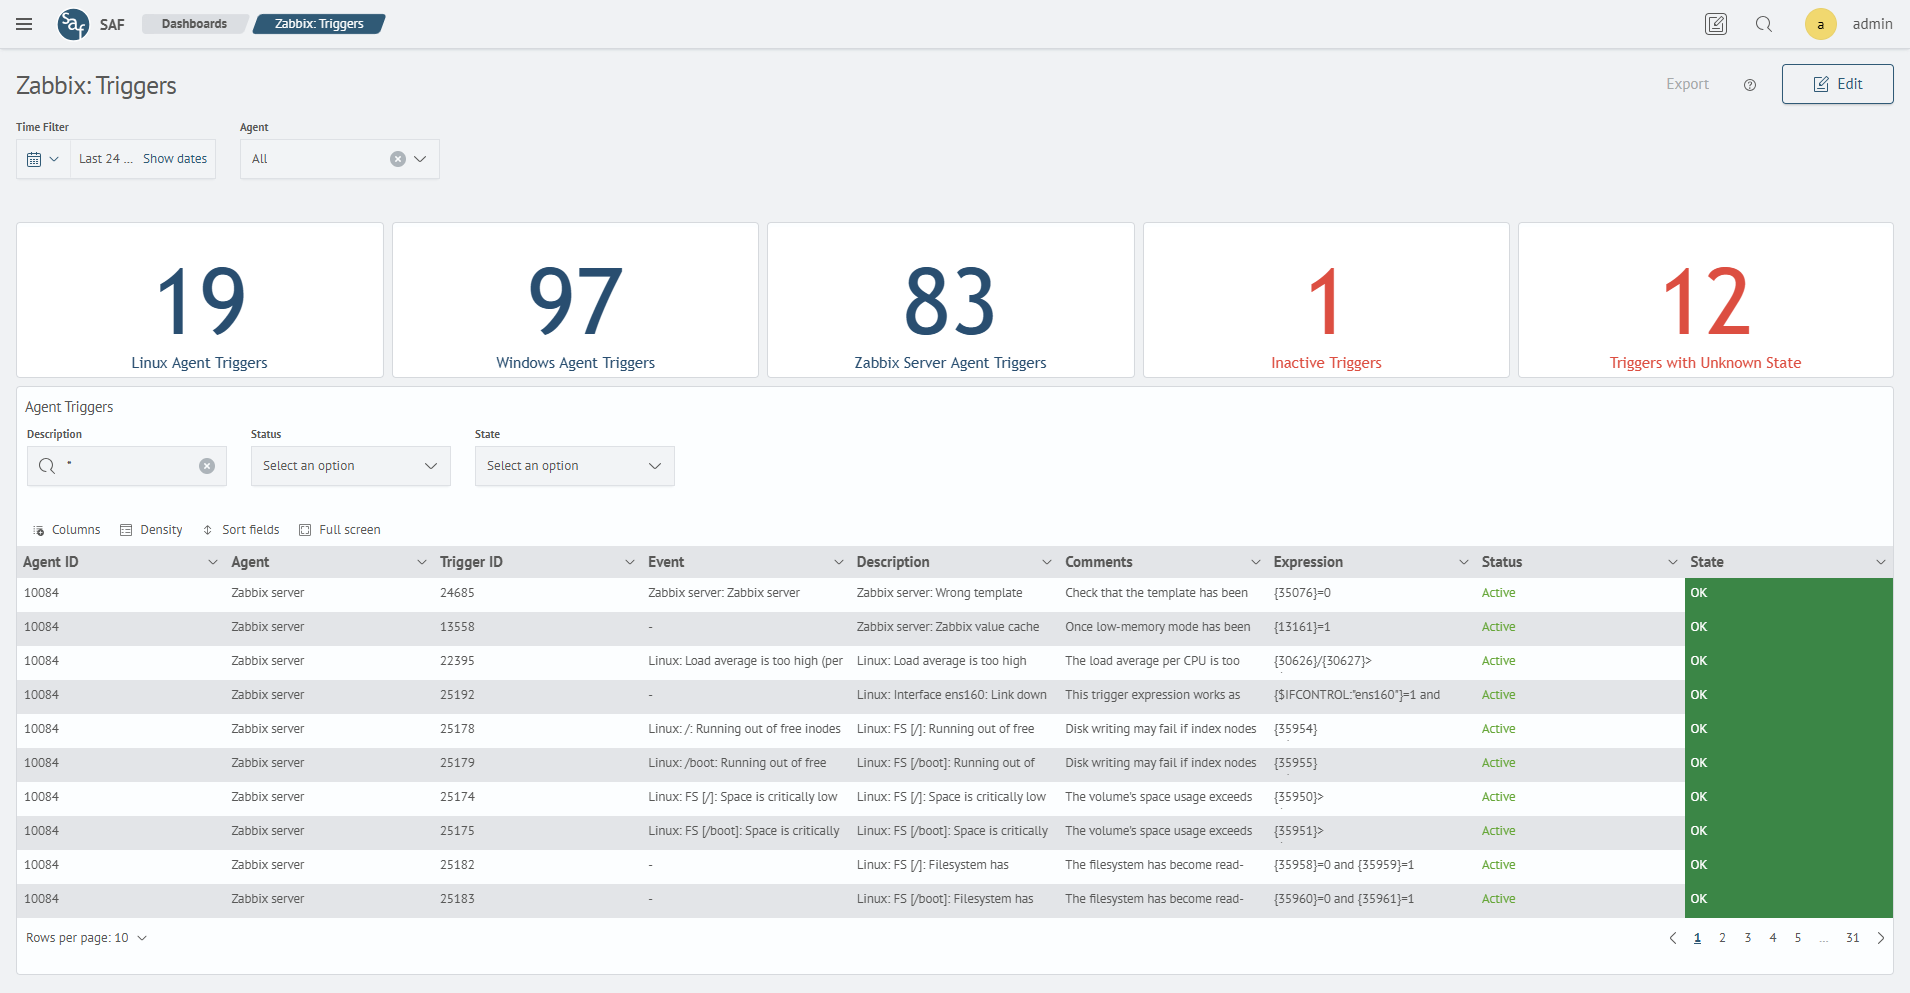
The Zabbix: Triggers dashboard provides summary information on the status and activity of triggers, allowing for quick assessment of their count per agent and identification of potential errors.
Triggers Statistics
Key metrics are displayed:
- triggers received from Linux agents, Windows agents, Zabbix server
- inactive triggers
- triggers with
Unknownstate
Below is a table with detailed information for each trigger, including:
- agent name
- trigger ID
- information on event, trigger description, and comment
- trigger status and current state