ASM Tree
Description
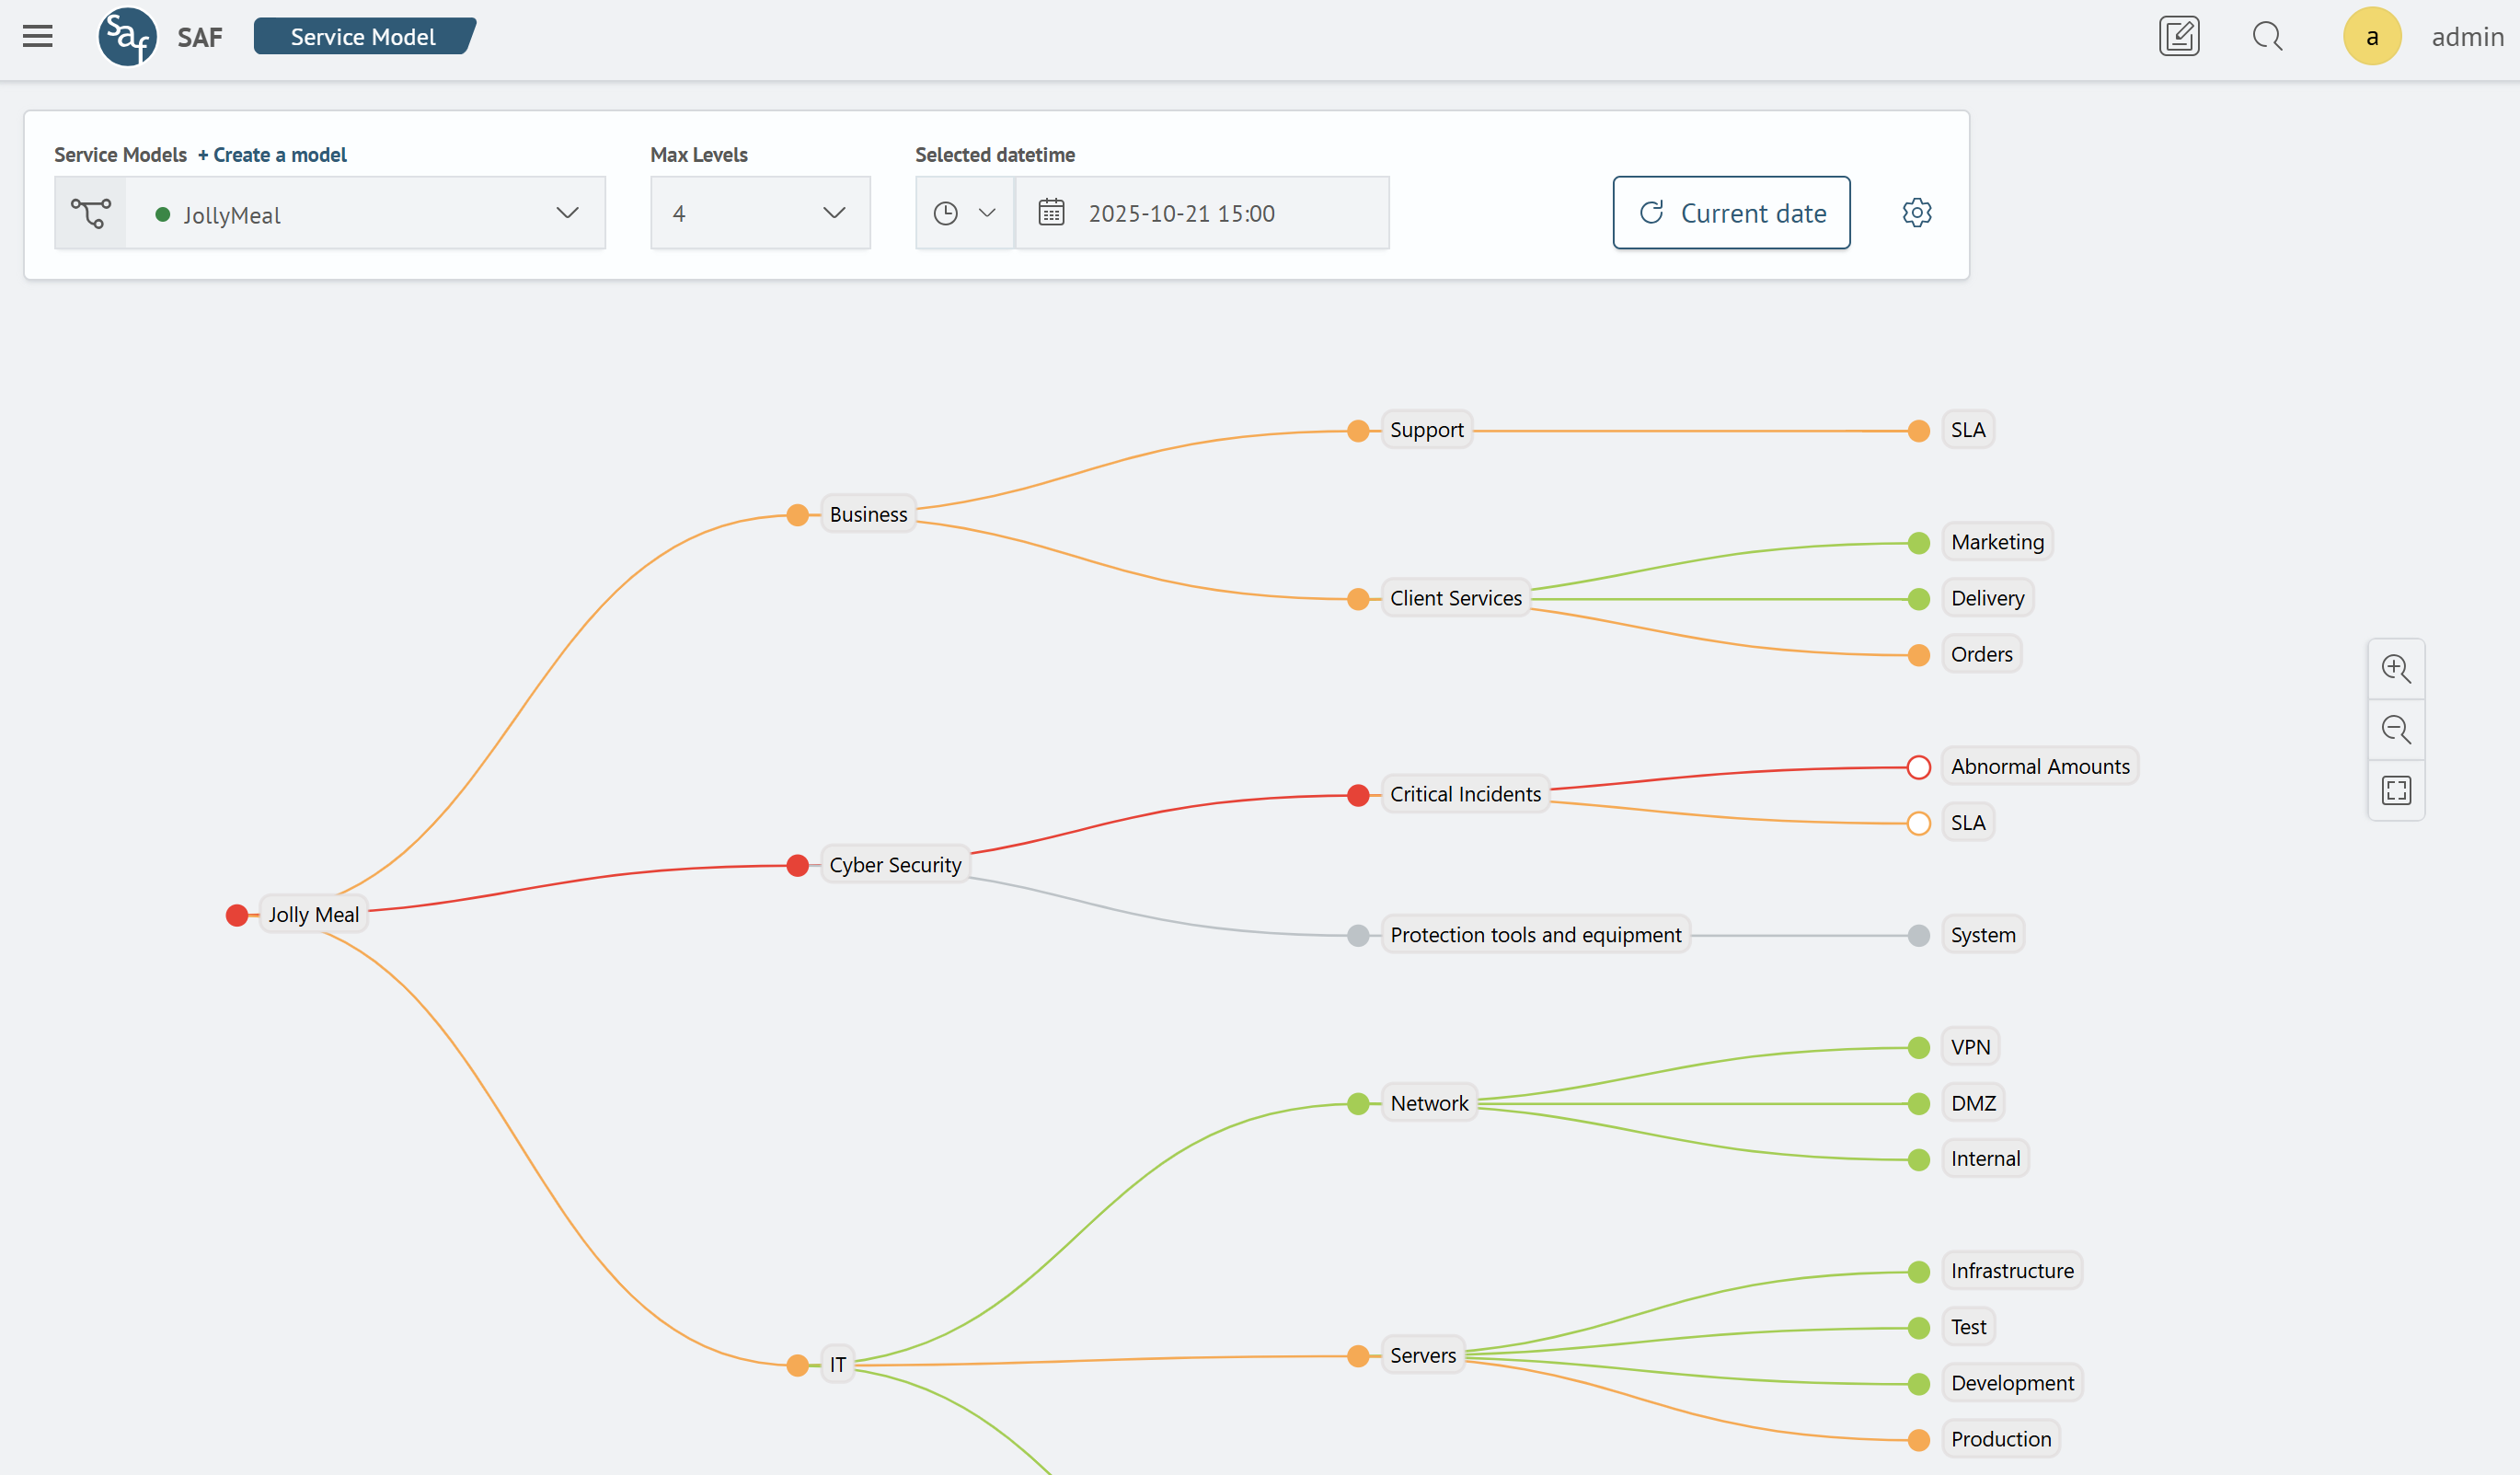
A tree is a visual representation of monitoring components, consisting of nodes (indicators) and connections between them.
The page interface includes a control panel at the top and a main area (canvas) where the tree itself and related indicators are displayed.
Example page:
Main Features
The tree allows you to:
- view the current state of indicators
- visualize connections between indicators
- track metric states for each indicator
- search for indicators and metrics by name
- view data for selected time ranges
- use automatic tree updates for real-time monitoring
- navigate to detailed information about each indicator
Control Panel
This panel allows you to create and edit models, set time ranges, and select levels.

Main panel elements:
- Dropdown list for model selection
- Create model
- Level selection
- Data refresh button
- Time interval selection
- "Current date" button
- Button for searching and editing models, indicators, and metrics
Model Selection
This dropdown list allows quick switching between models.
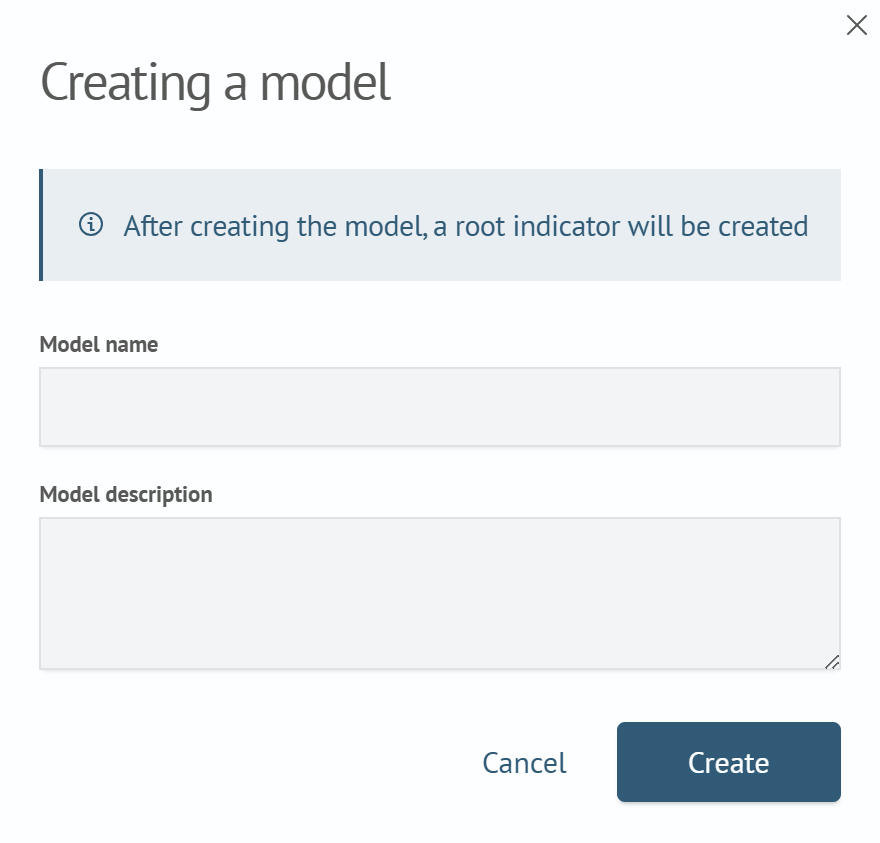
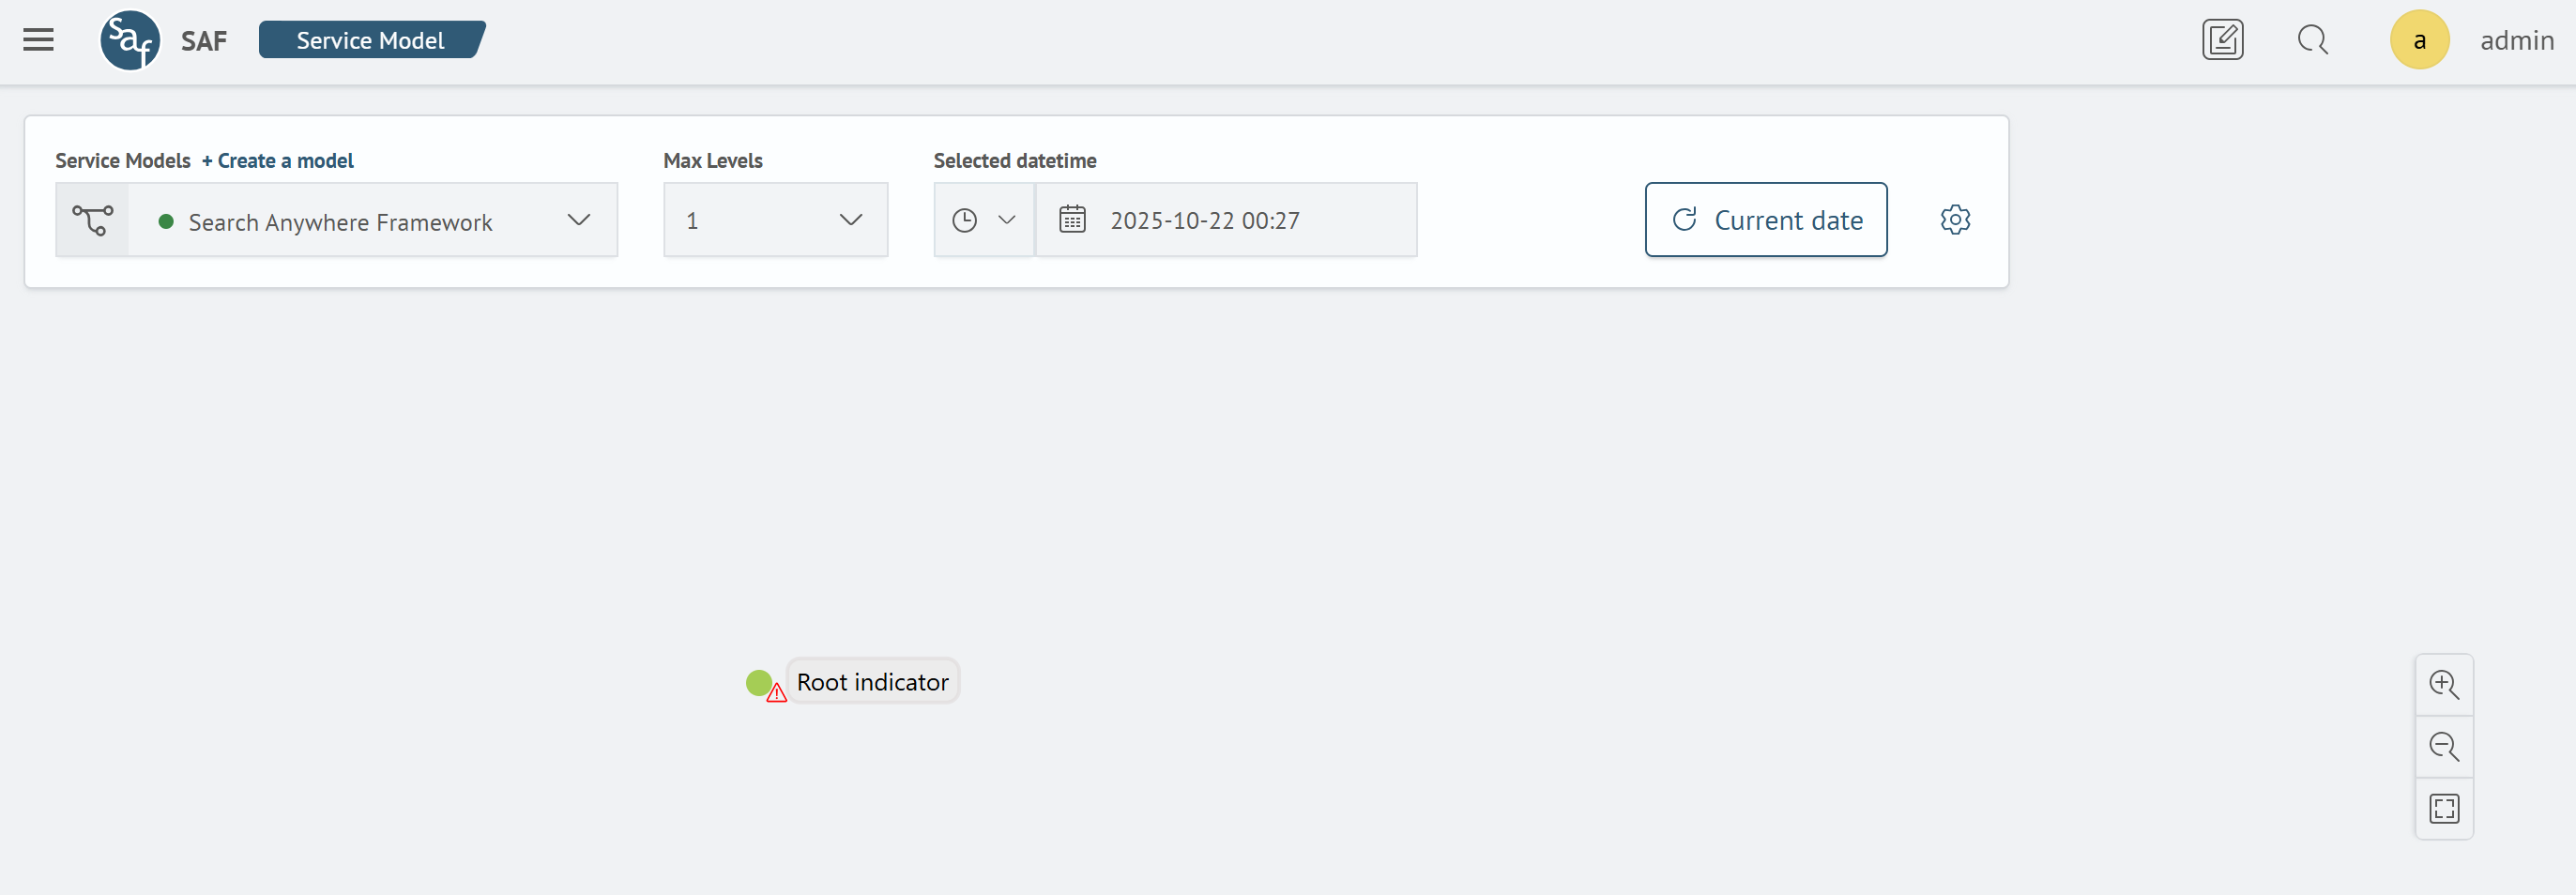
Create Model
This button initiates model creation. After clicking it, you need to enter a name and description, which will create a model node with a root indicator at the first level. The model is automatically assigned a unique system name.
Level Selection
Dropdown list of levels, generated based on the selected model.
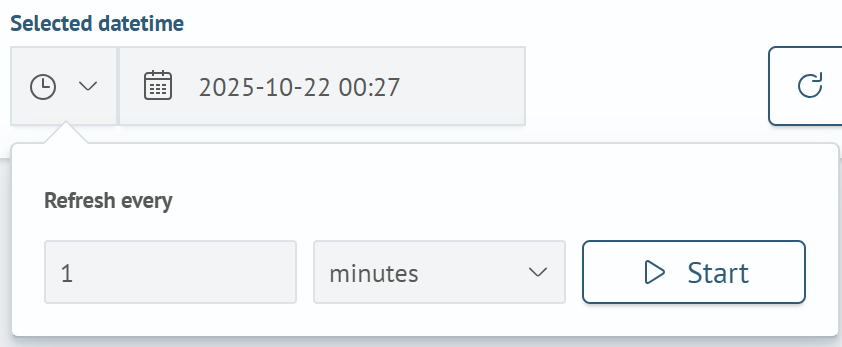
Data Refresh
Configure the automatic refresh interval. To start it, select a period and click Start. To stop - click Stop.
Time Interval Selection
This control allows more precise configuration of requests and obtaining information only for a specific time period.
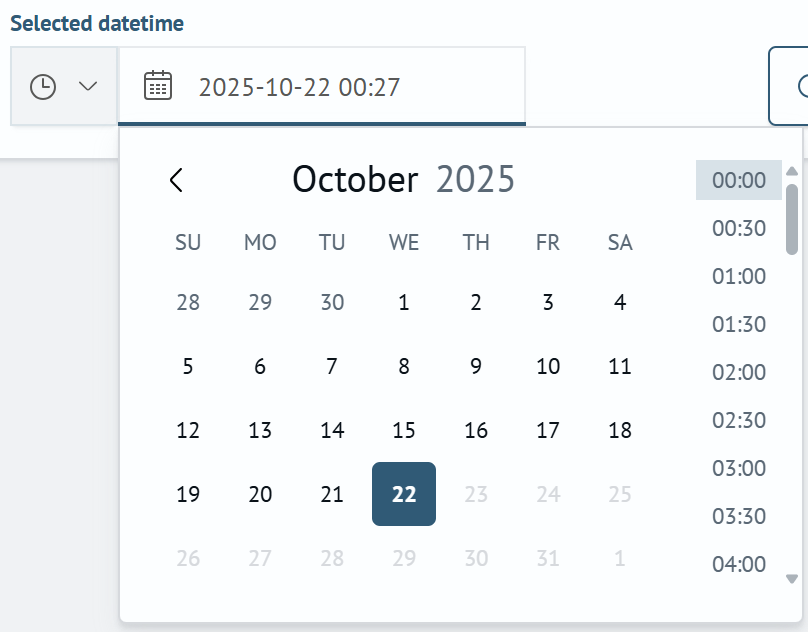
Current Date
Let's also translate this: clicking this button sets the current date and updates all tree data.
The following are updated:
- all model data and its indicators
- metric indicators
- all data on the open metrics panel
Settings
Clicking the button opens a modal window with a list of all available models, indicators, and metrics.
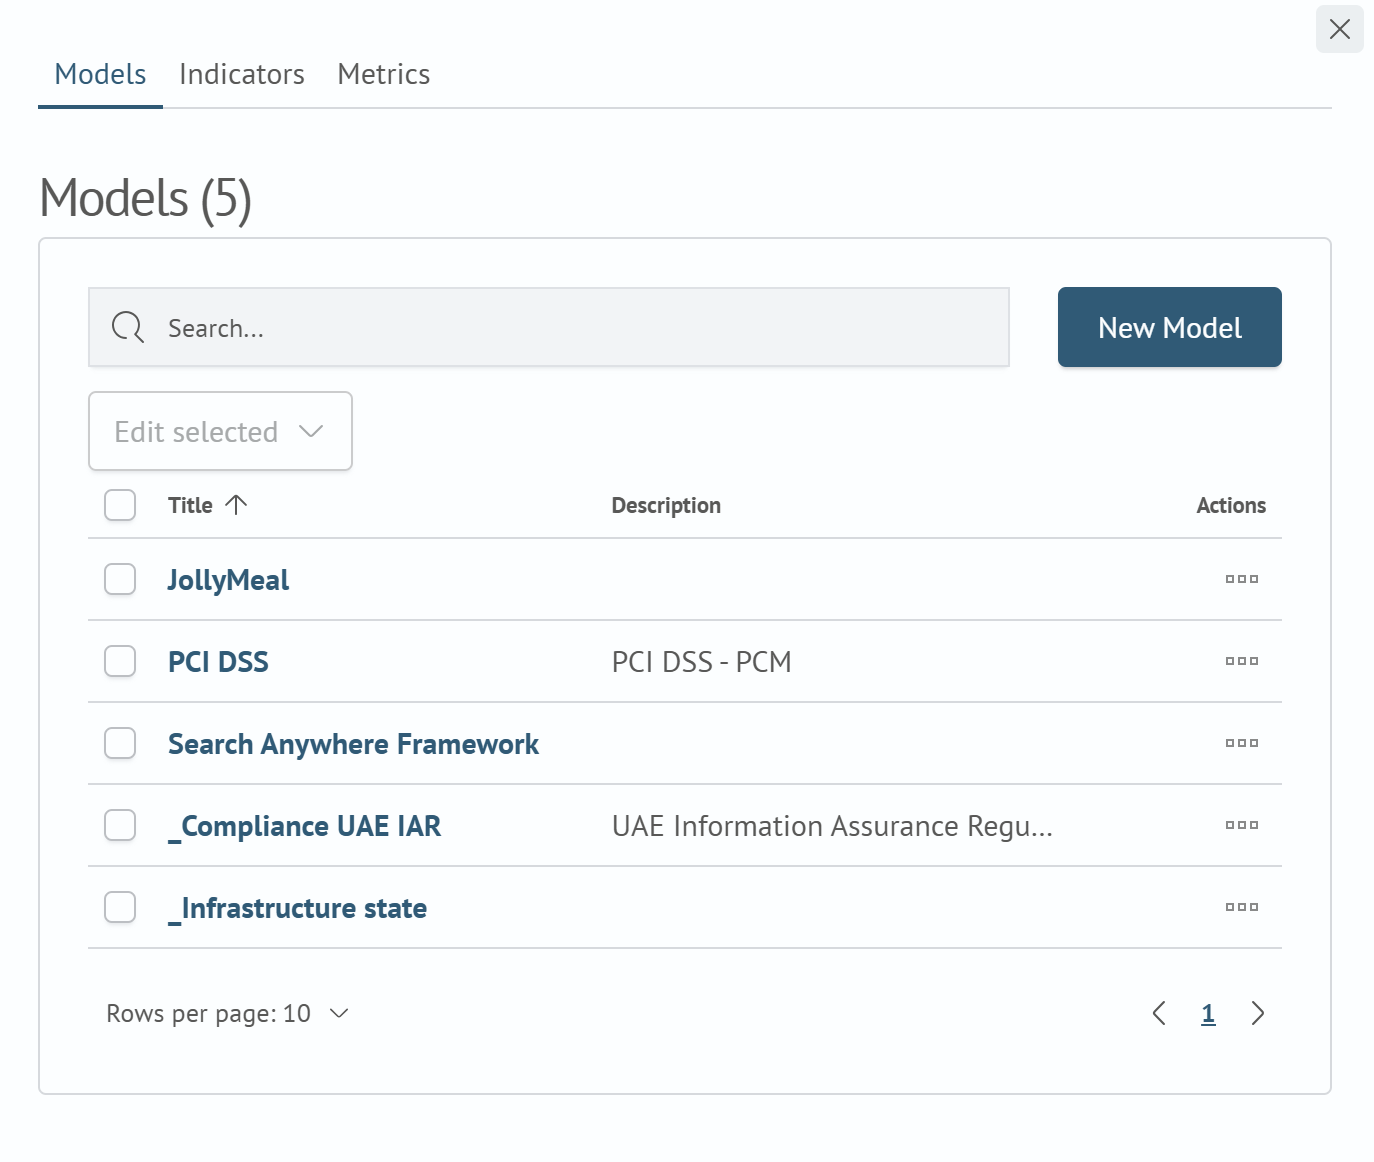
Capabilities:
- search
- create model, indicator, metric
- edit
- delete
- clone
- configure access rights
Node
Each node on the tree represents a separate indicator.

Main elements of an indicator:
- node name
- connections to other nodes
- overall health indicator
An indicator can have one or more connections, or none at all. All connections on the tree are directed from left to right.
Node Actions
Interact with a node as follows:
- Select the target node with a mouse click
- Select the required action from the opened menu

Available Functions:
Create Node
To create a new node:
- Select a parent indicator
- Select the type of node to create - indicator or metric
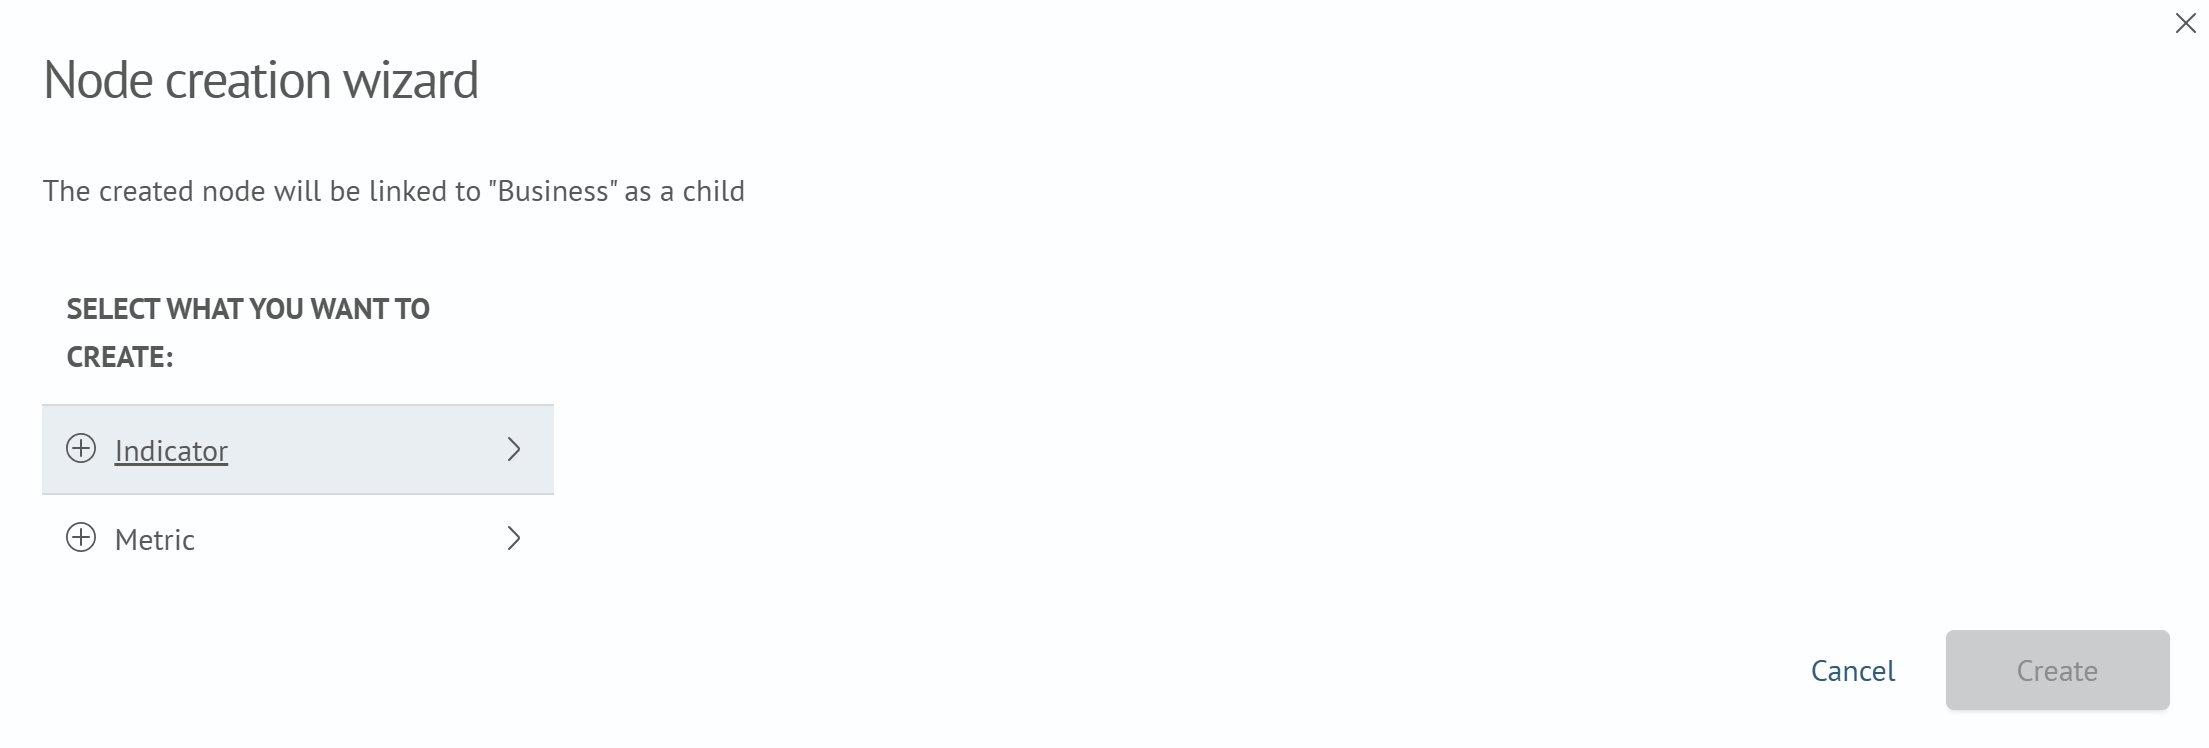
The new node will be created in the hierarchy as a child of the selected parent indicator.
Display as Root
This function sets the selected indicator as the root node, visualizing its entire subordinate hierarchy (child indicators and metrics) as a tree.
This item is only available for child indicators.
Configure
Provides the ability to edit properties of the selected indicator, including its name, description, and dependency management.

Delete
Deletes the selected node after confirmation.