Create dashboards
Building dashboards
Create from the Dashboards section
To create a dashboard from the Dashboards section, you need to open the Main Menu and select the Dashboards item in the Core section.
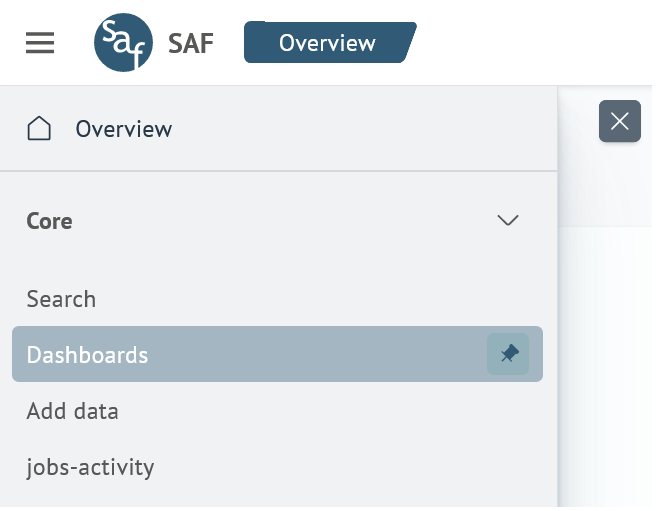
After that, a list of all available dashboards will be displayed.
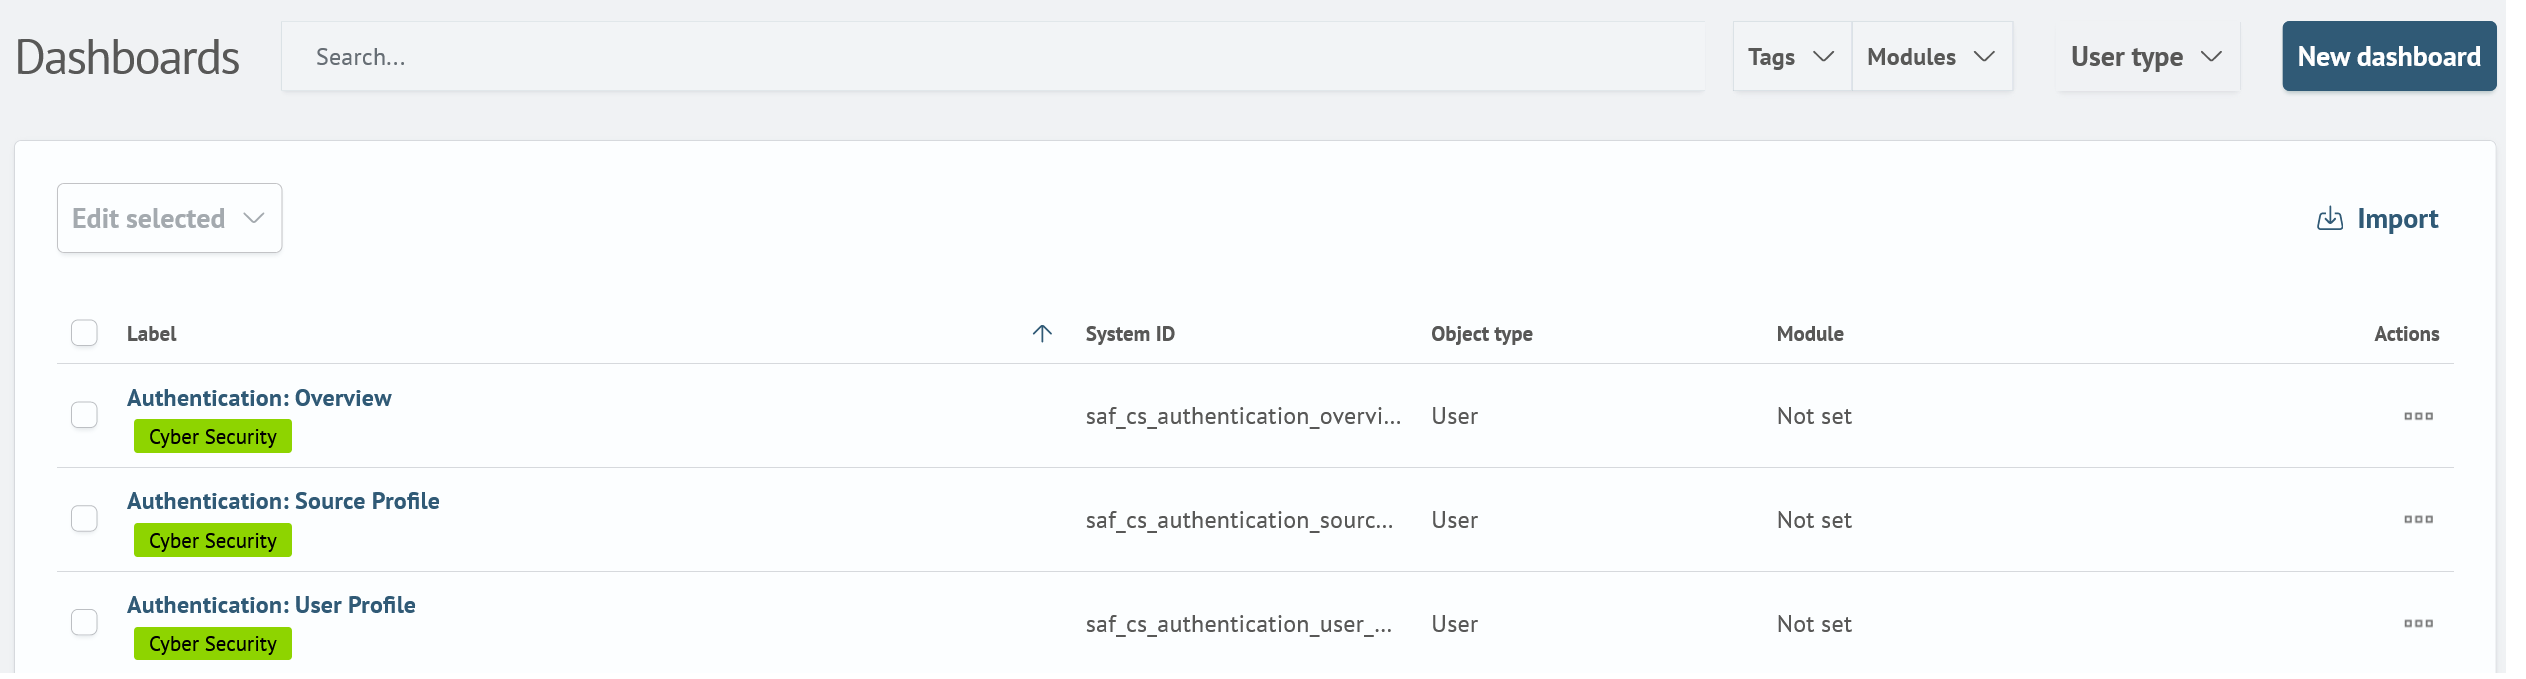
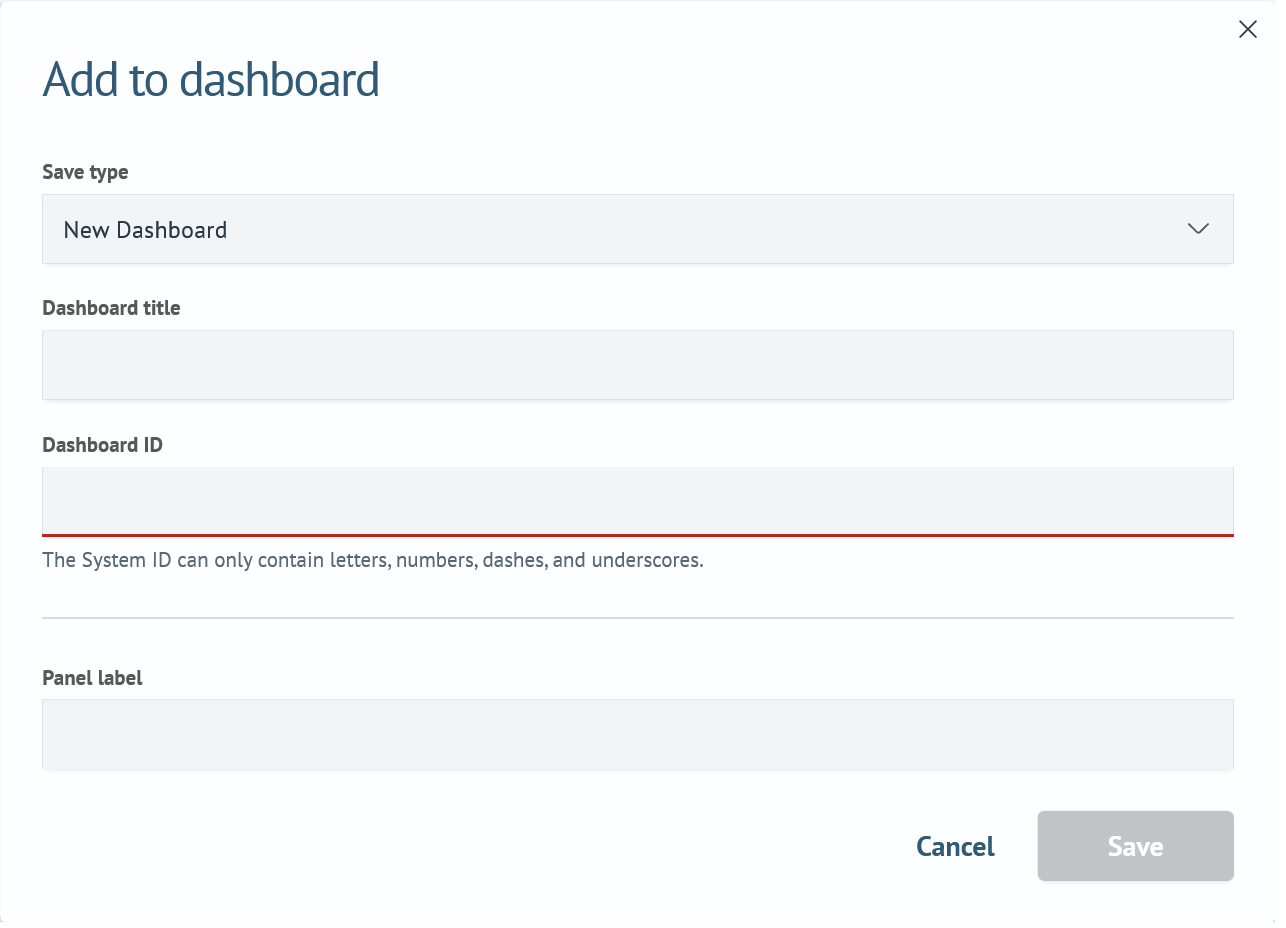
Then you should press the New dashboard button, a modal window will be displayed, which includes the following fields:
Title- the displayed name of the dashboardSystem ID- system name of the dashboard
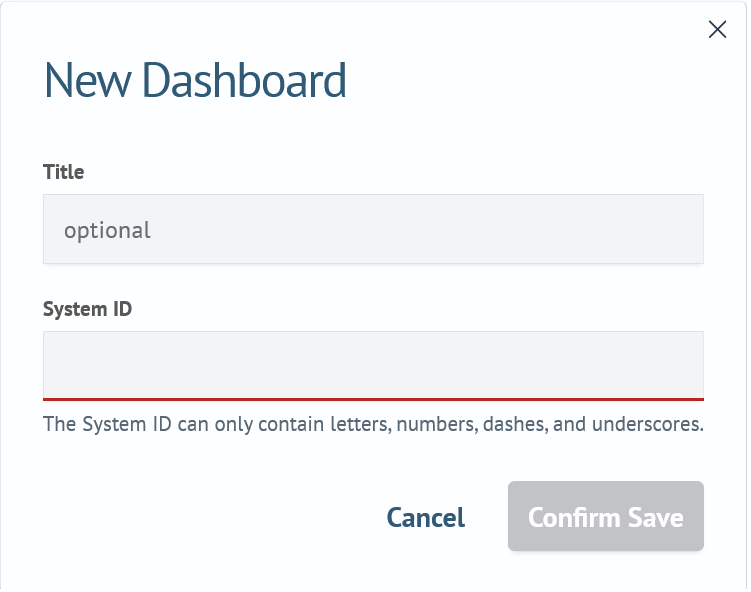
Please note the tooltip below the System ID field. If these requirements are not met, the field will remain colored red (an indication of incorrect field content). If all fields are filled in correctly, the dashboard will be saved.
Clicking on the Confirm Save button will create a dashboard and navigate to the page of the newly created dashboard.
Create from the Search section
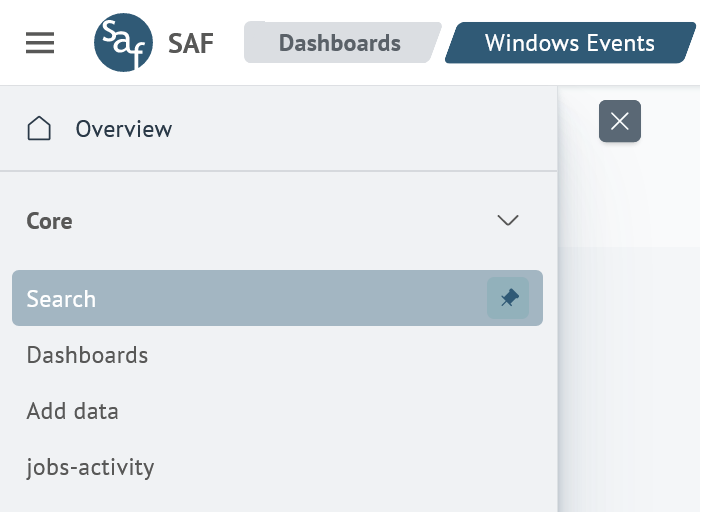
To create a dashboard from Search, open the Main Menu, select Search in the Core section.
In the search input you need to enter a query that returns visualizations or statistics, for example with the command timeaggs and run it. For example:
source windows_events
| timeaggs count by event.action
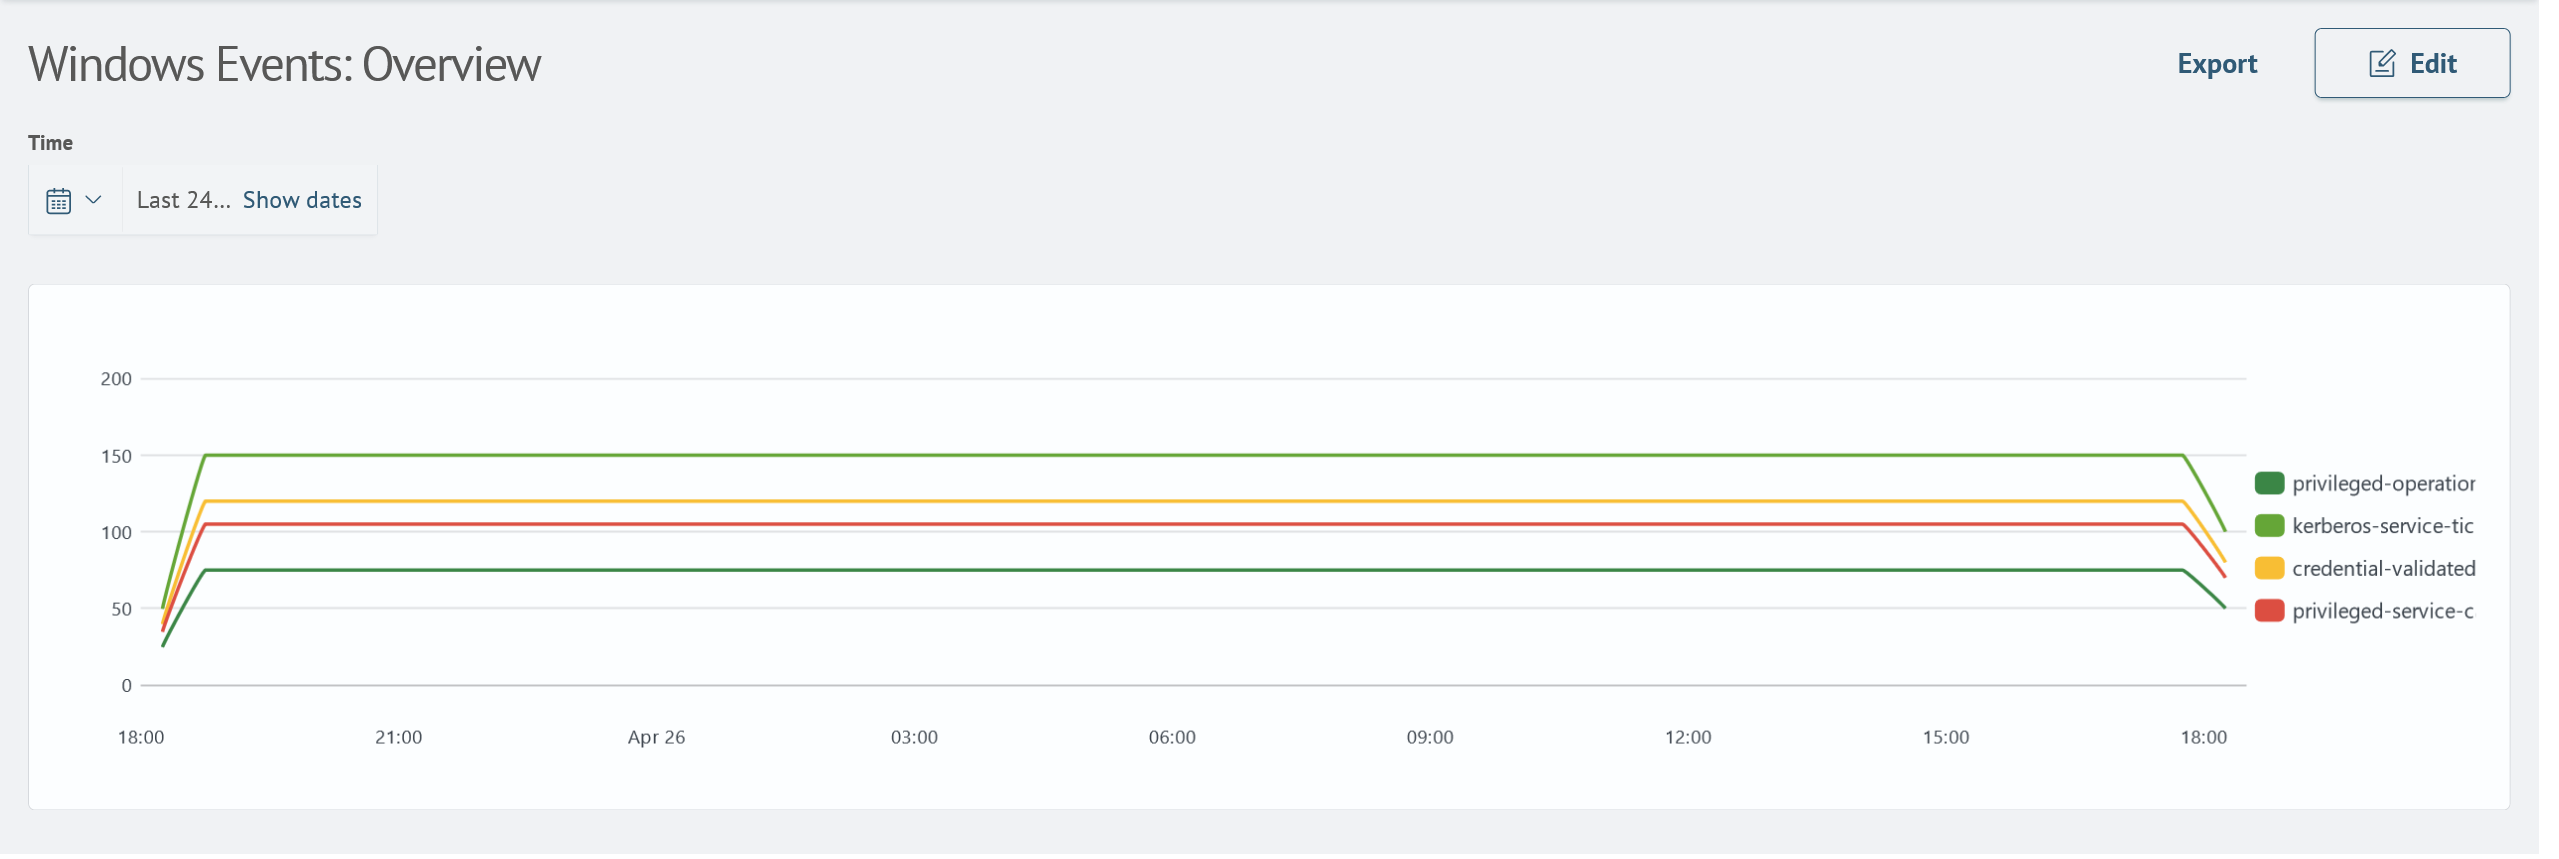
A visualization of type Line Chart will be displayed.
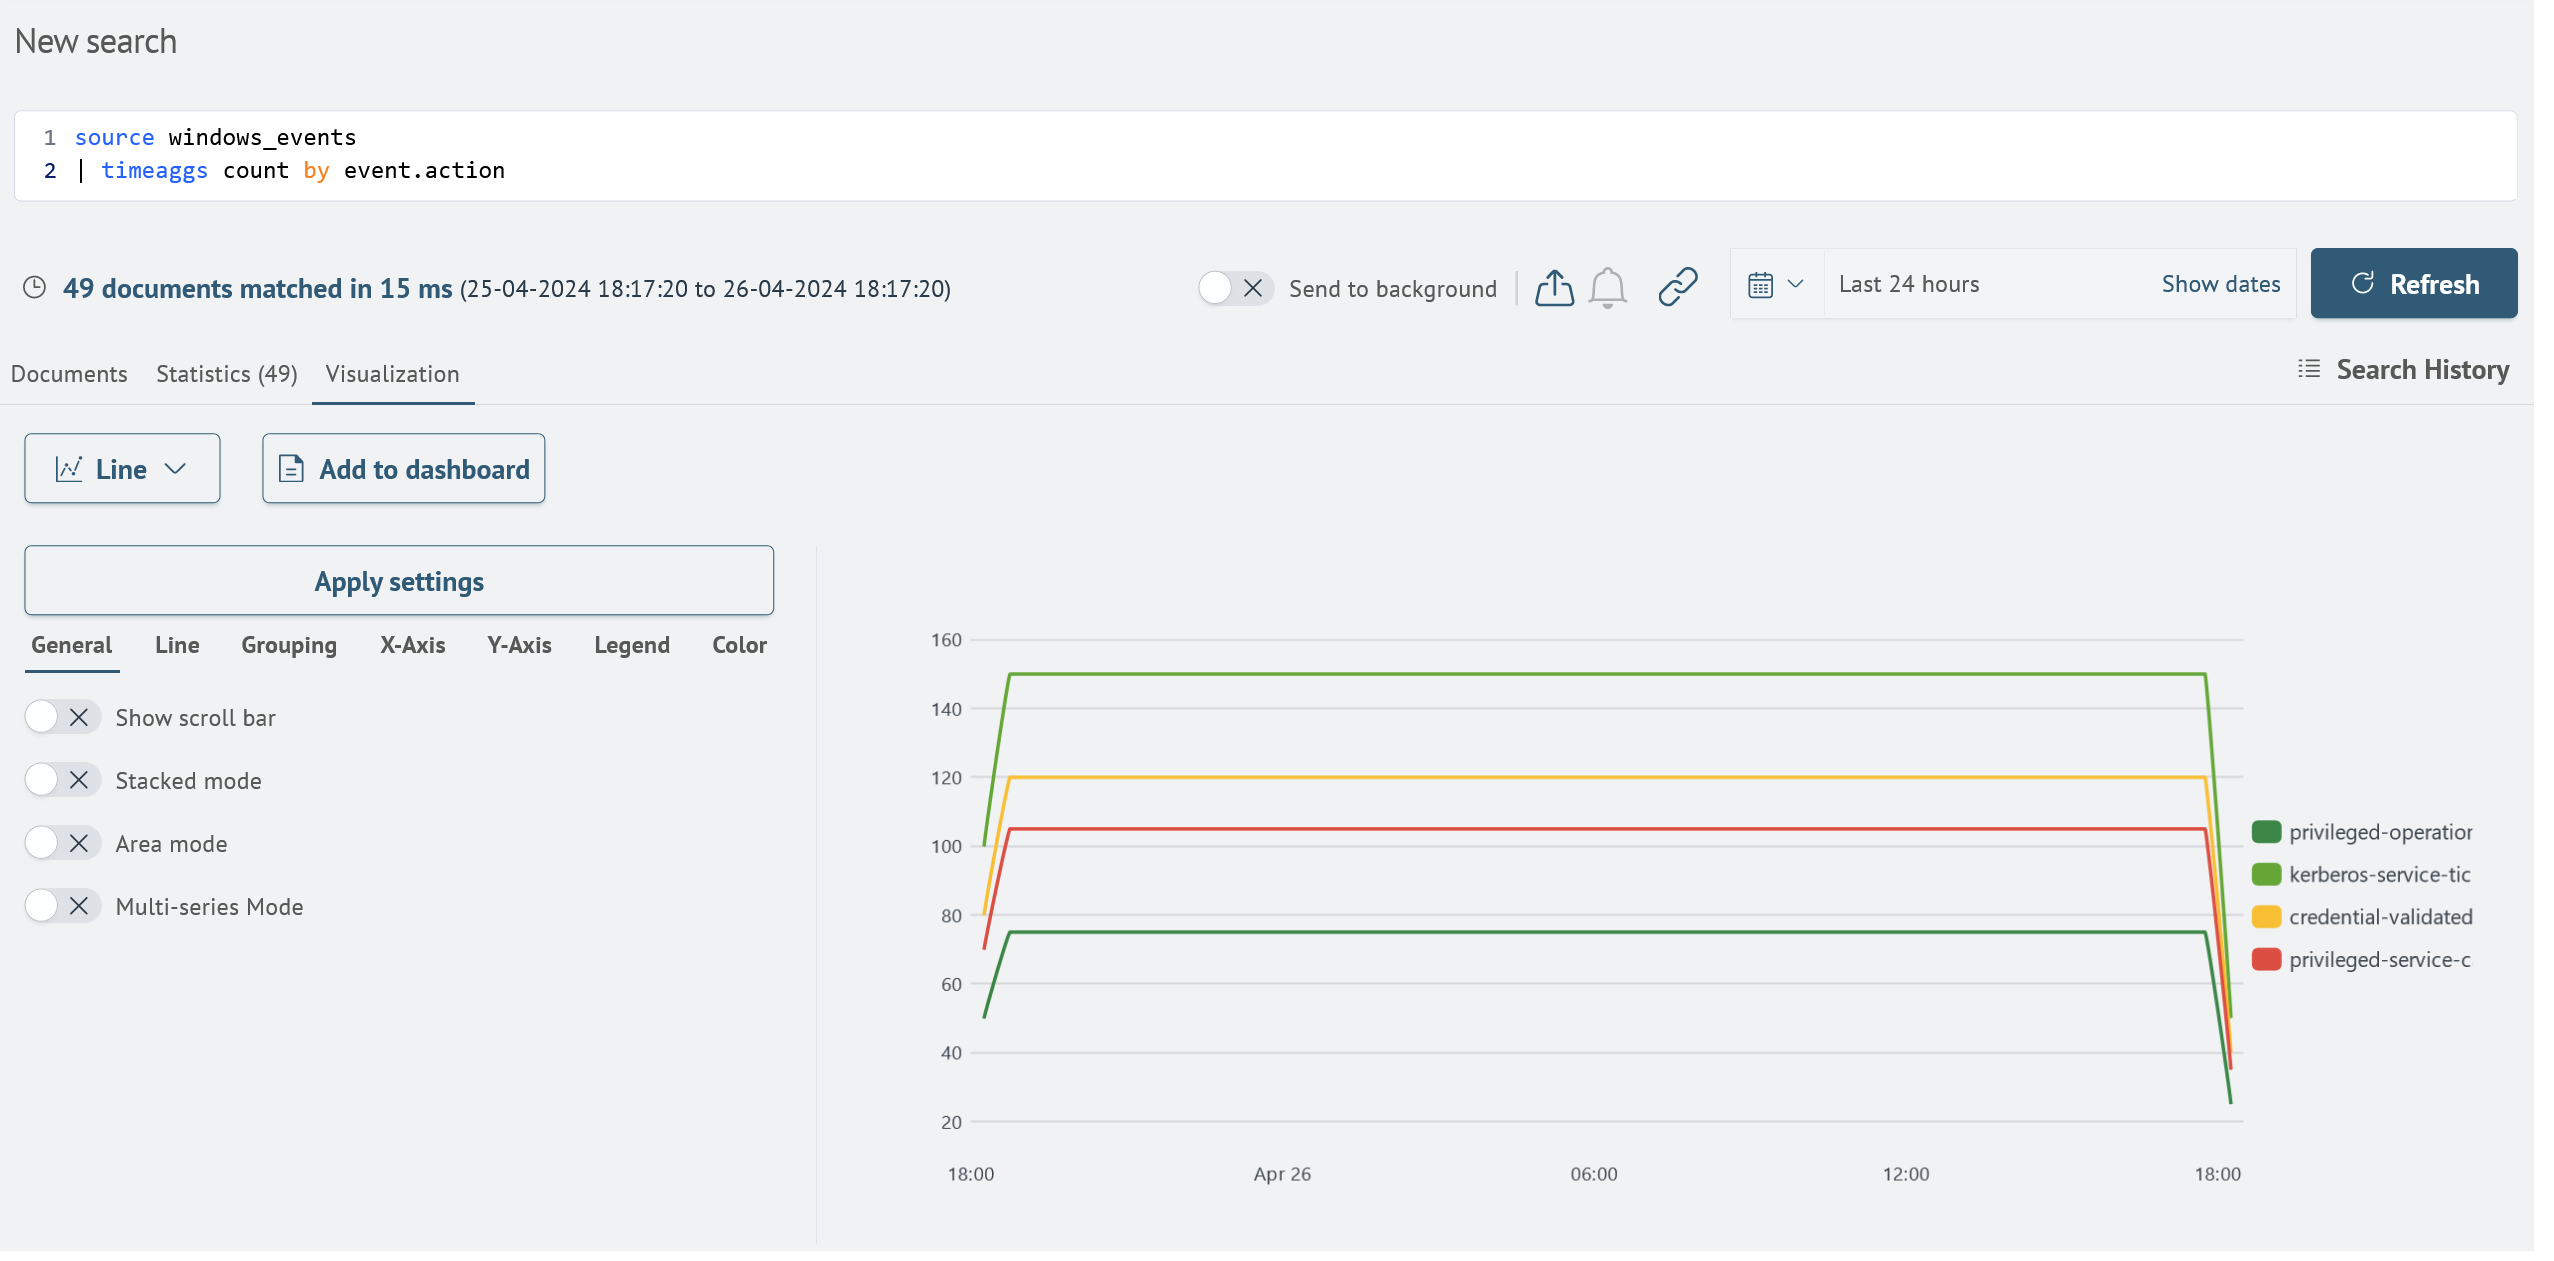
Next, when you click on the Add to dashboard button, you must specify the name of the dashboard by specifying New dashboard in the save type:
Click the Save button and select View dashboard. This way you can make sure that the dashboard has been created, and it can also be found in the Dashboards section.
Editor interface
A dashboard editor is available for creating and editing visualization panels, as well as their layout. This tool allows you to work both with the user interface and with the source code in JSON format. Thus, it is possible to choose the most convenient way of work.
Visual mode
You can create and update visualization panels using the Search Anywhere Framework.
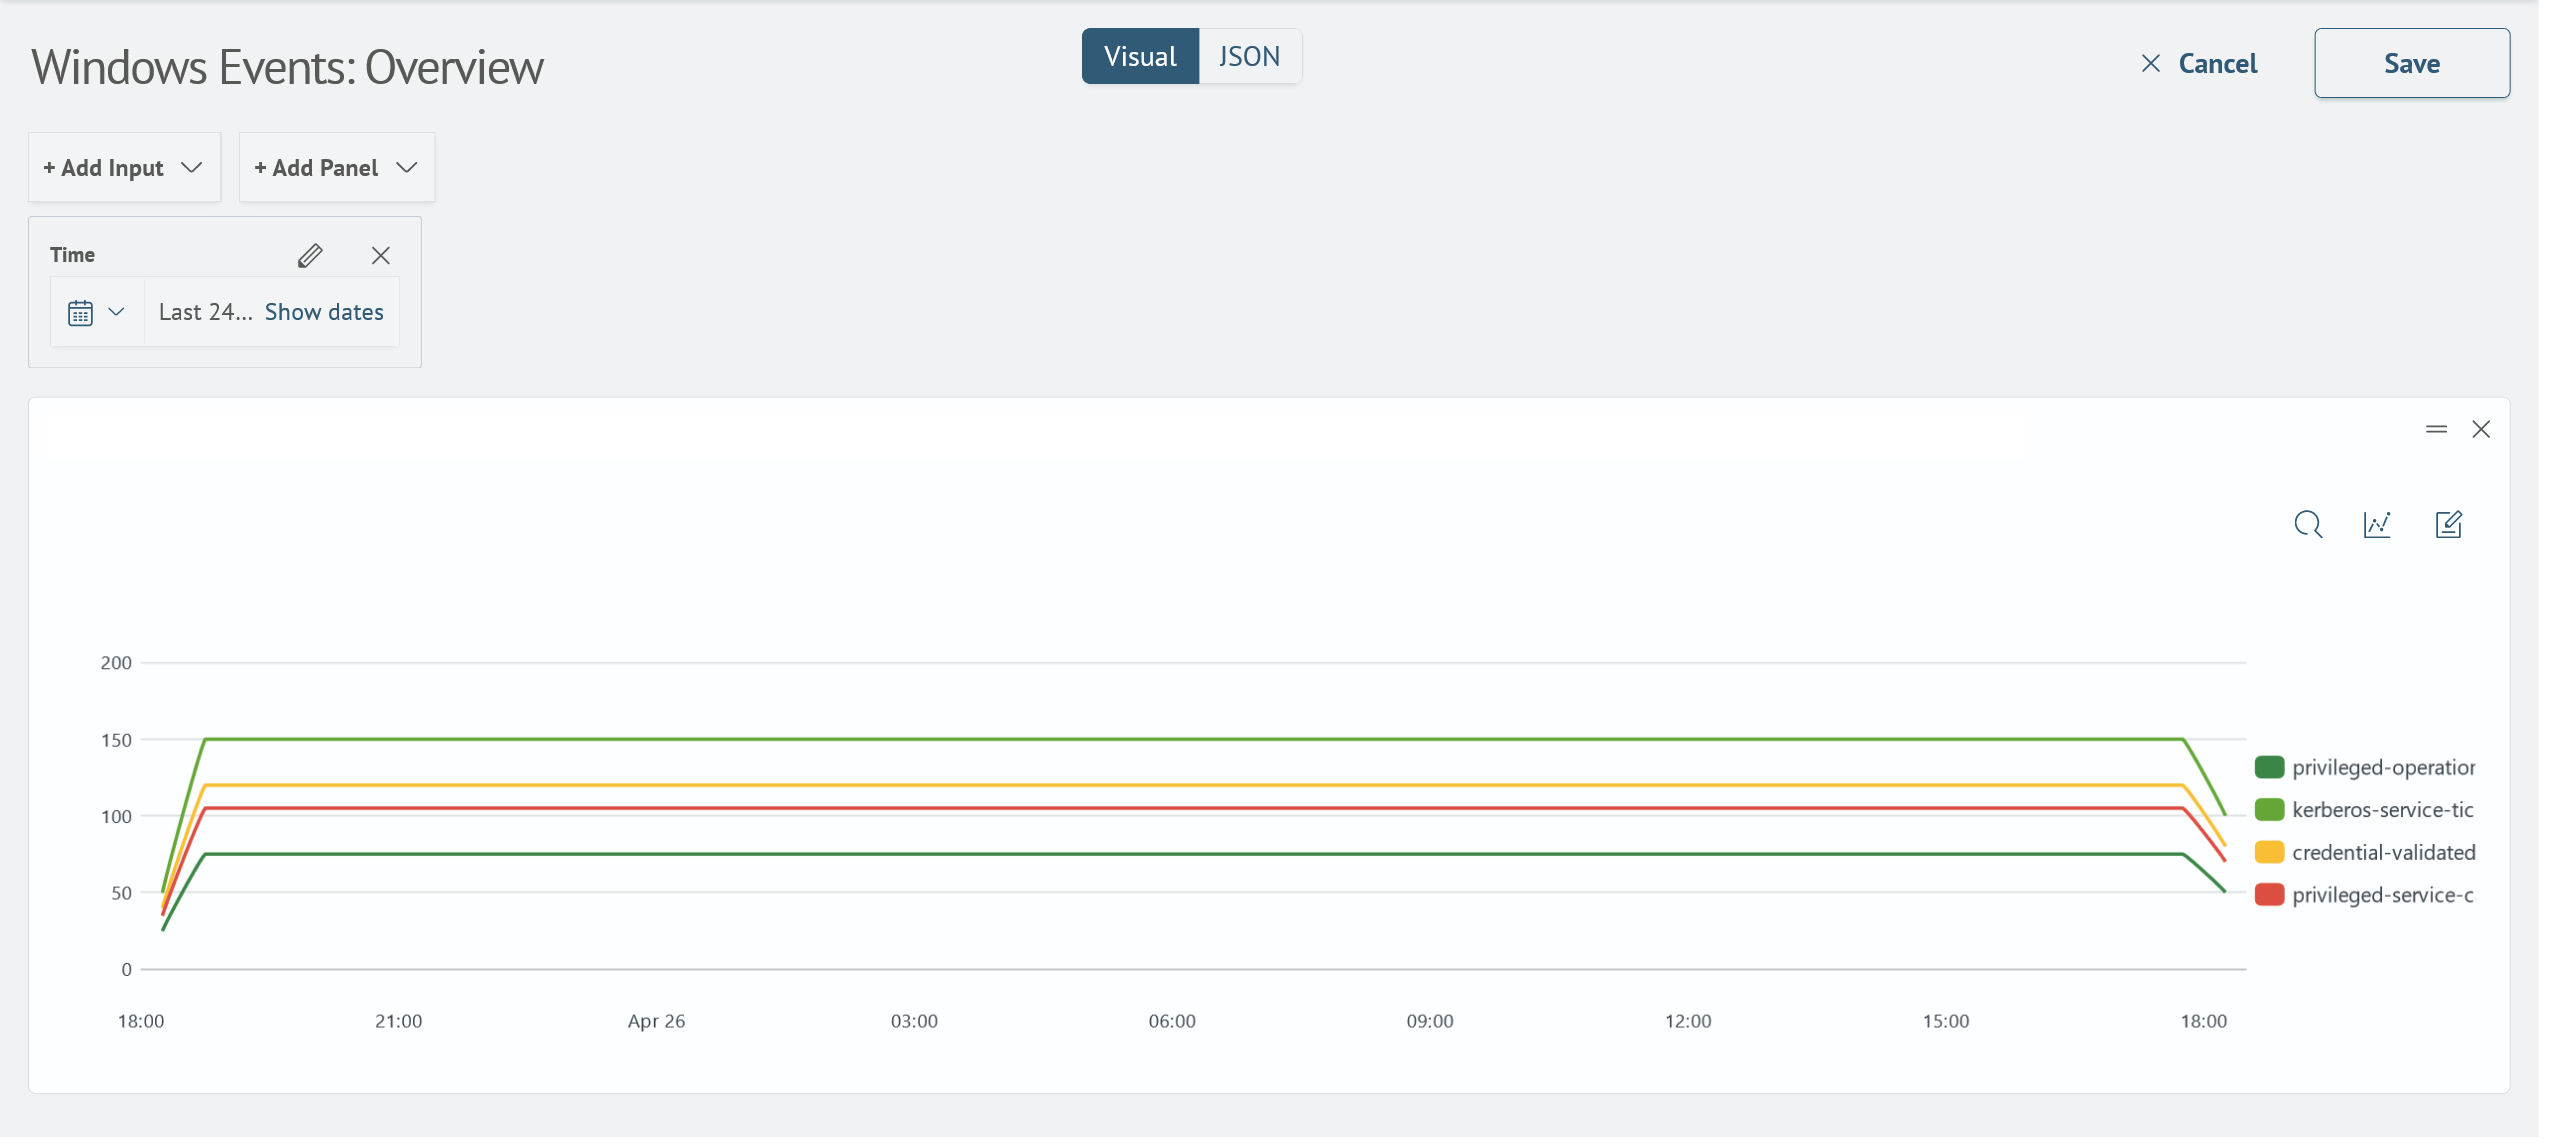
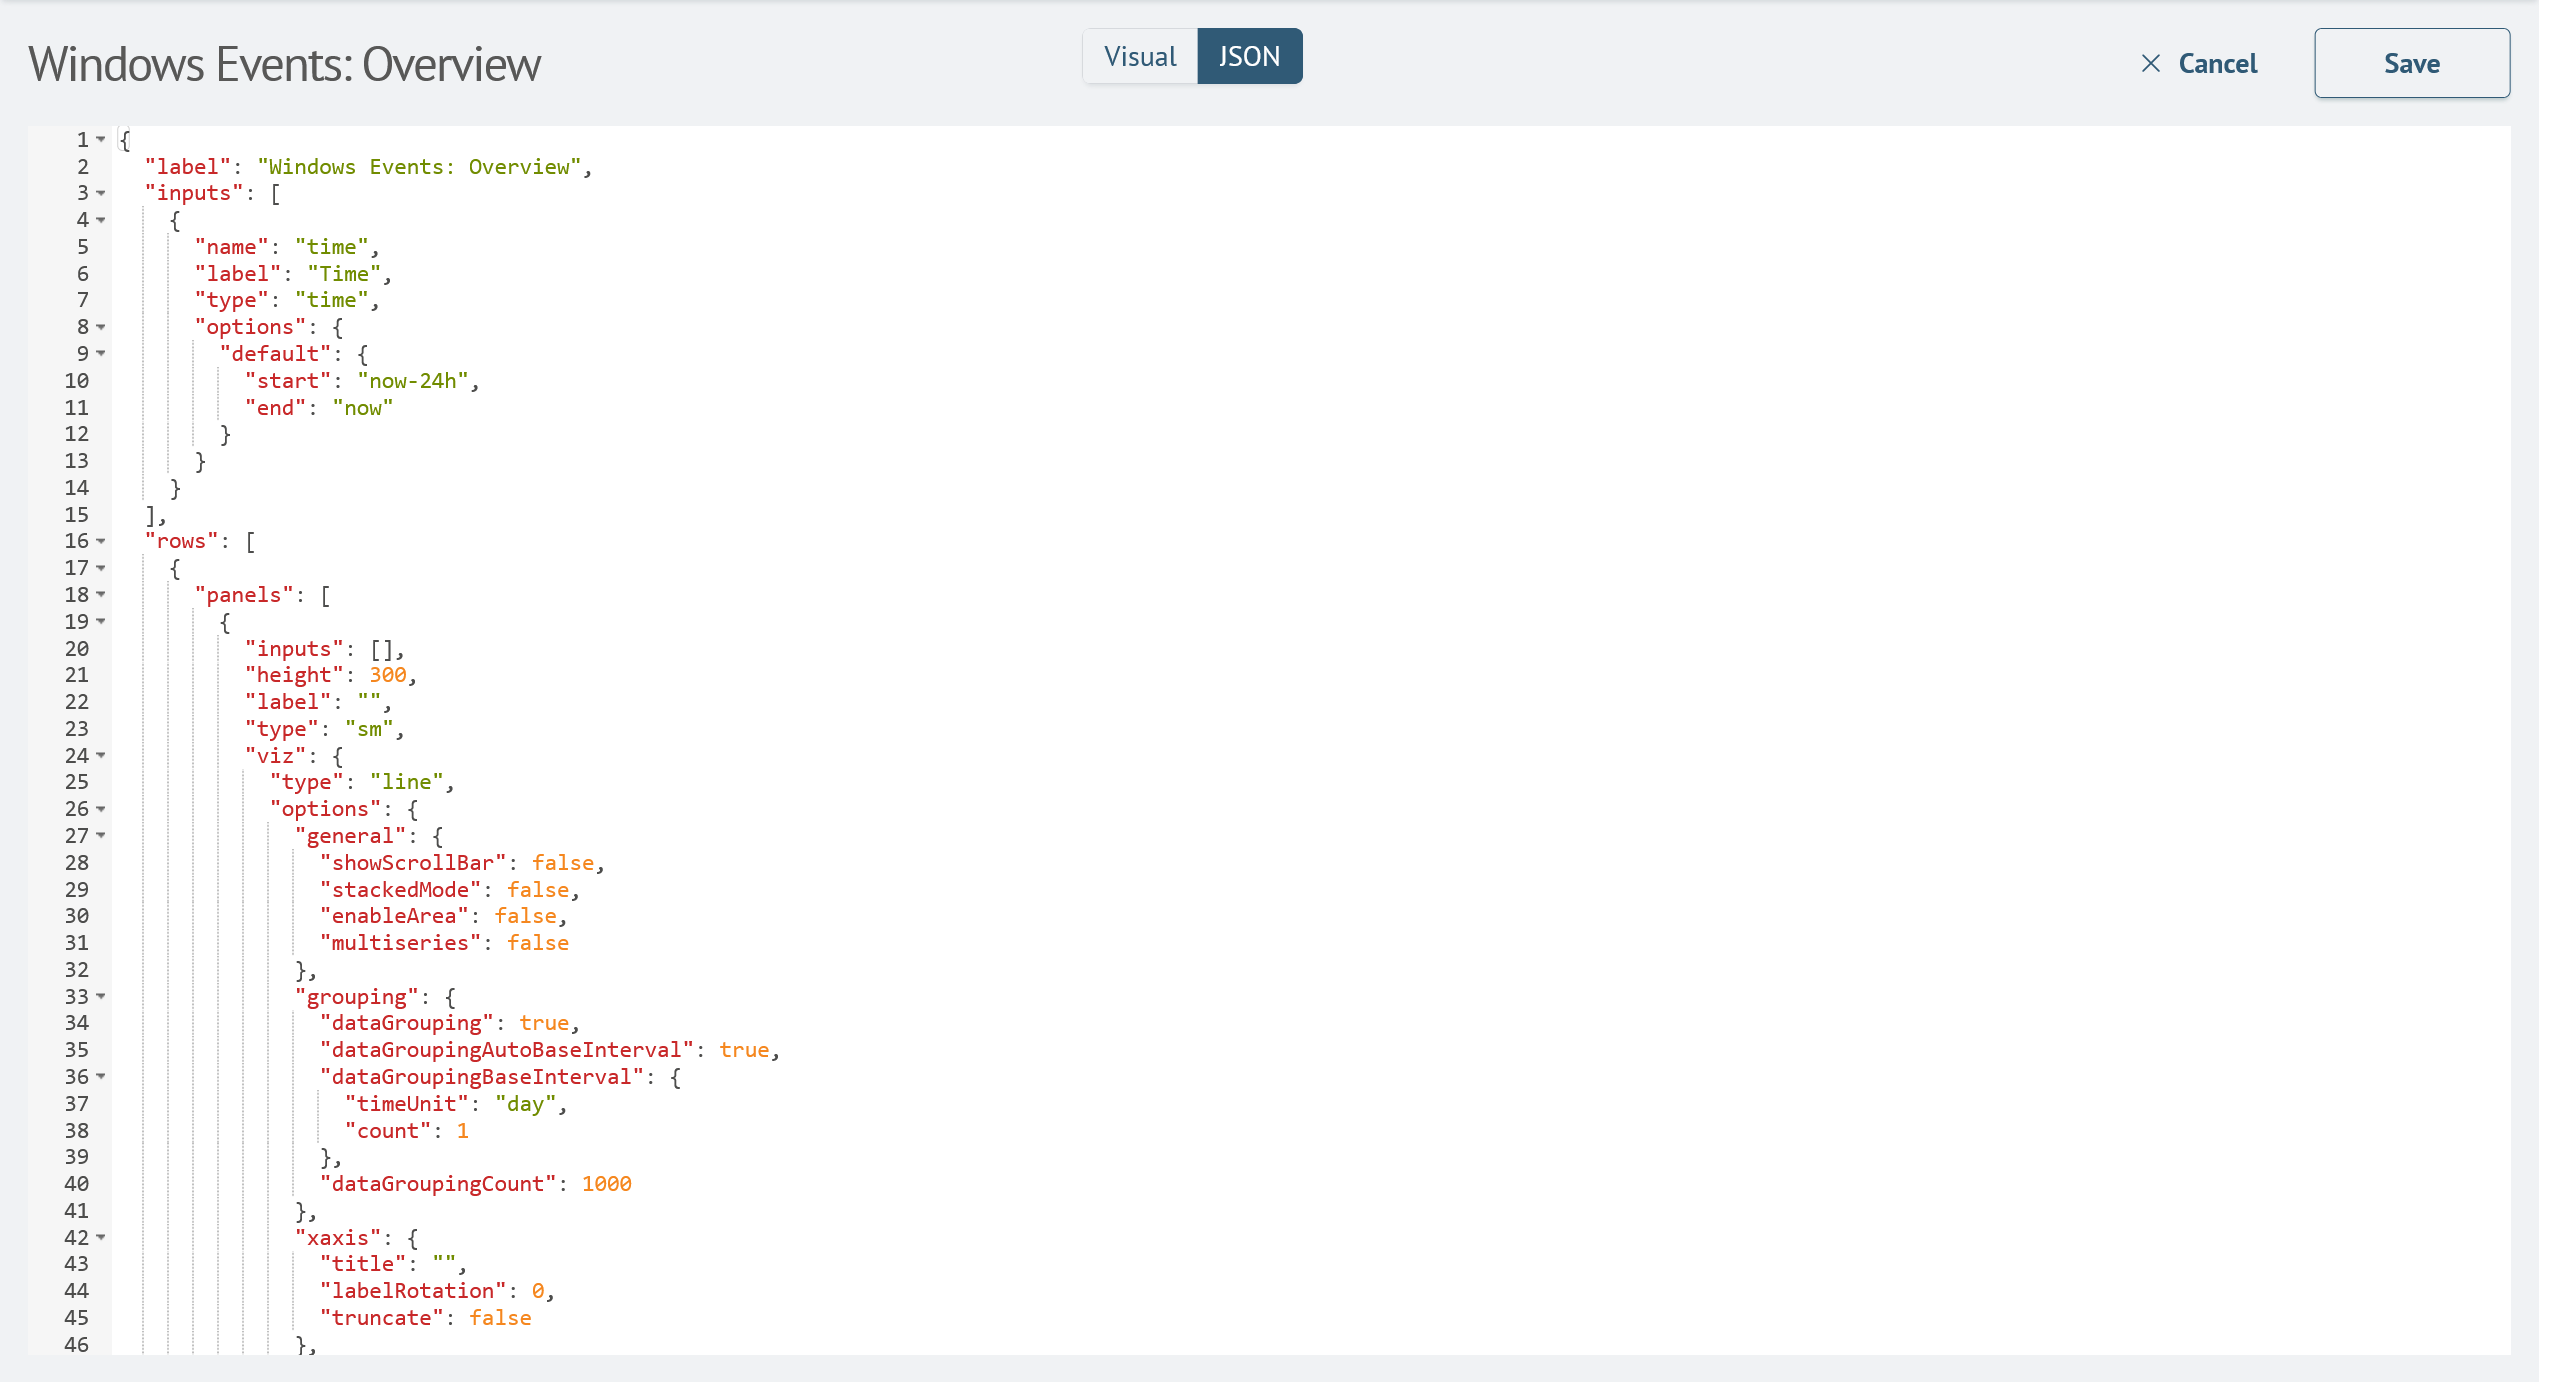
JSON mode
You can create and update visualization panels using the JSON source code editor.